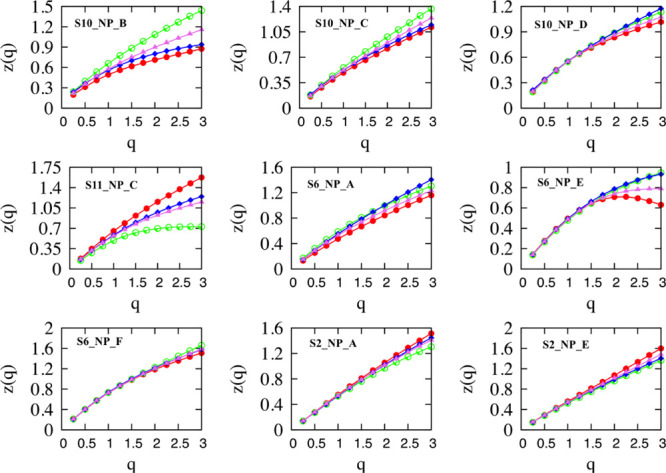
Figure 5.

Structure functions for motion in x, y axes; red for zx,x, and green for zy,y. In blue, the cross-correlation of movements in x and y axes. In violet, the theoretical value of the cross-correlation zx,ytheor(q) = (zx,x(q) + zy,y(q))/2. Notice that zθ,θ(q) is not illustrated because it takes zero values for all q’s.
