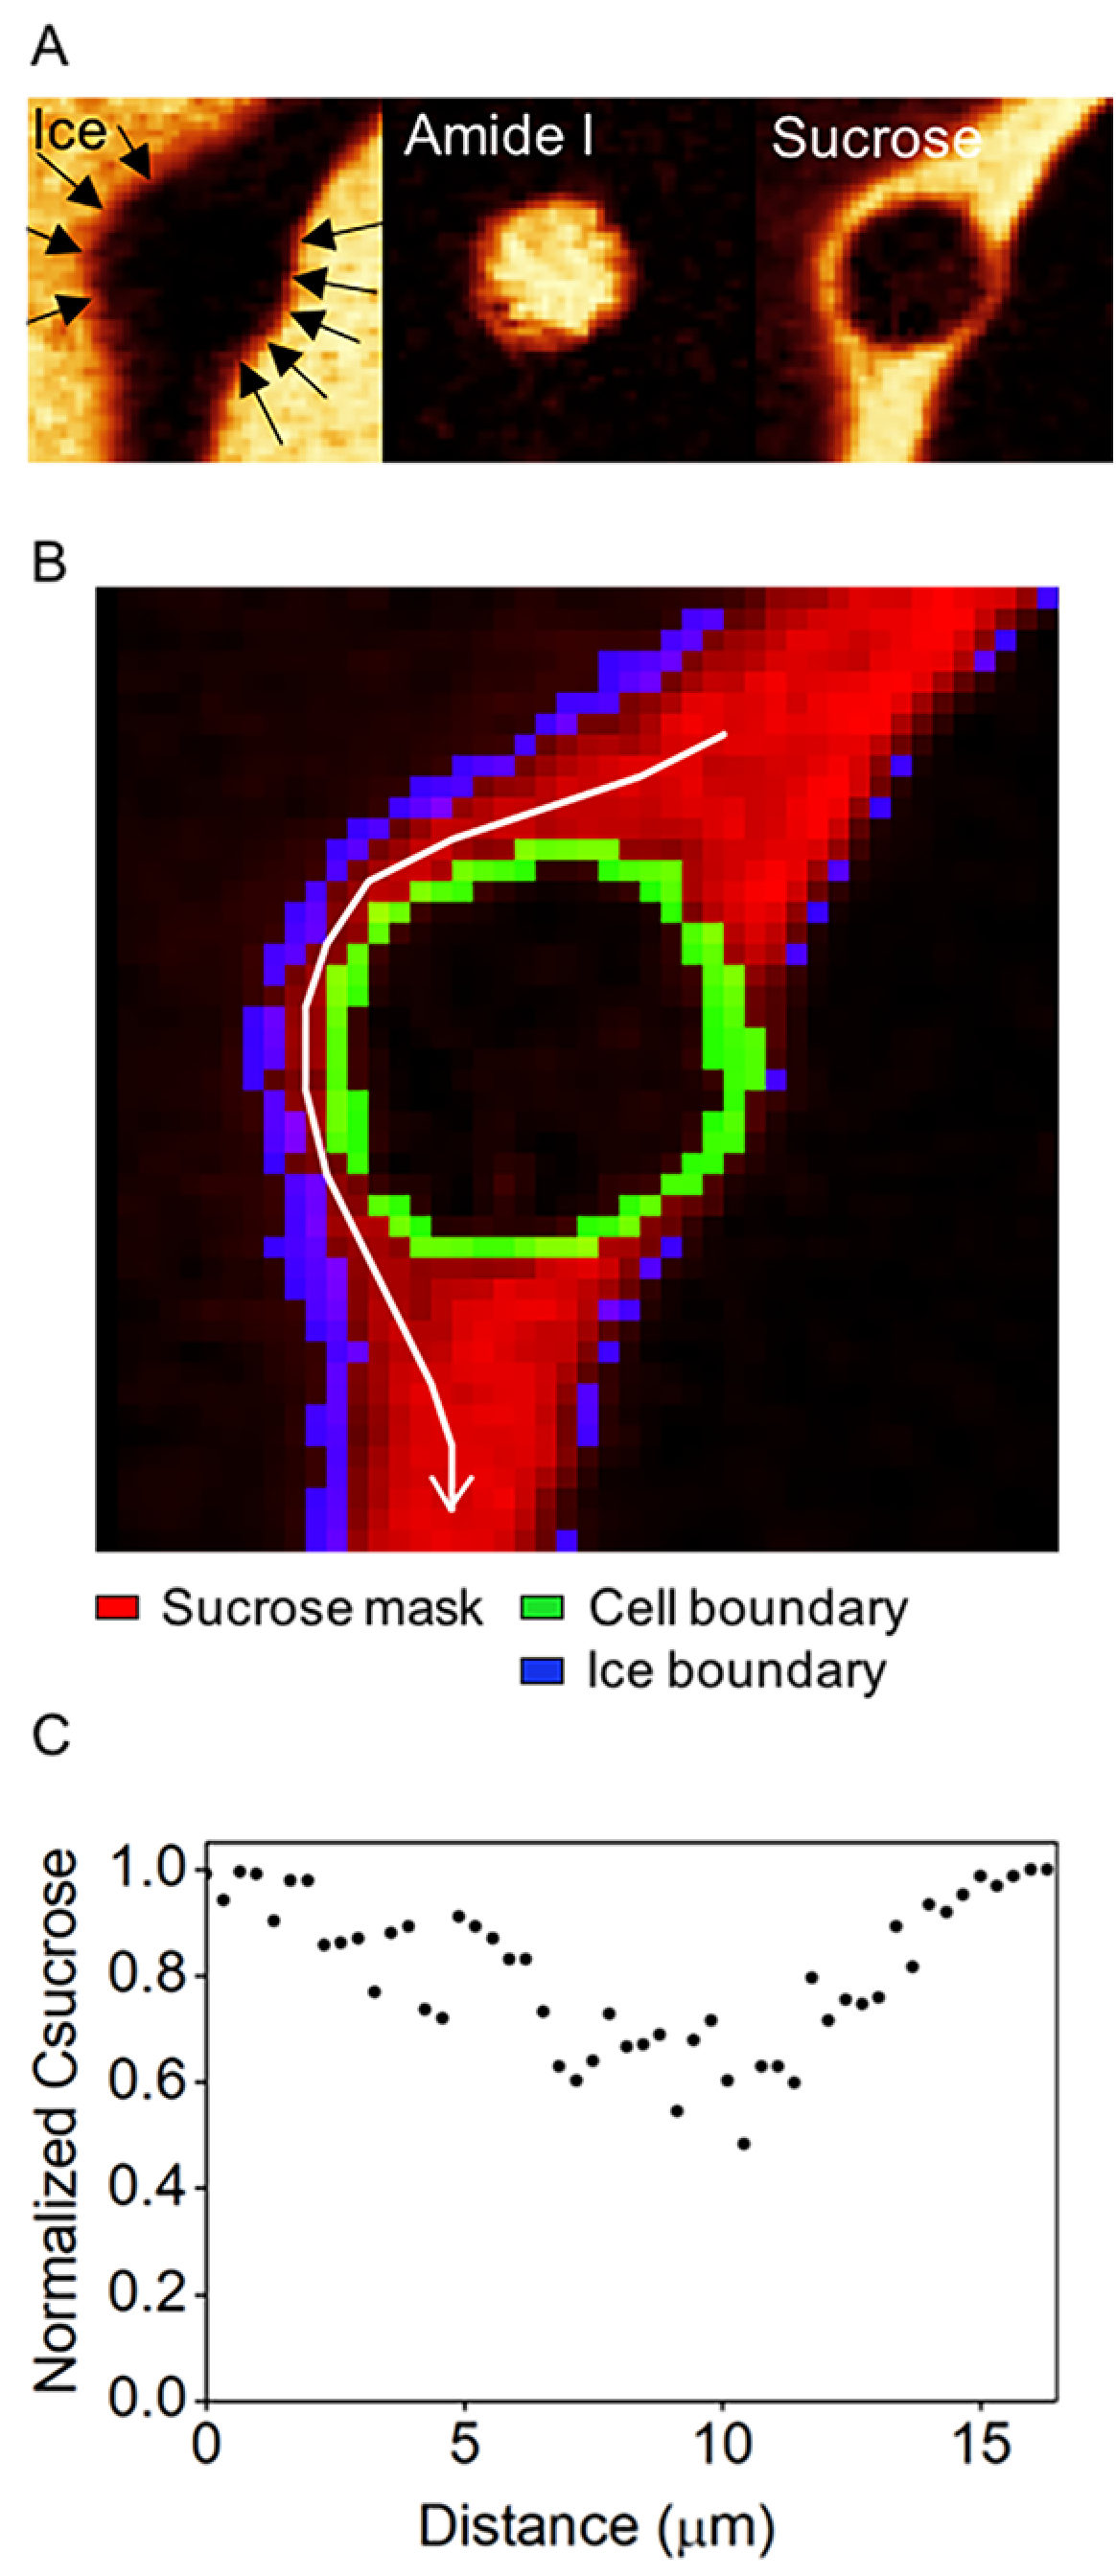
Figure 5.

(A) Raman image of ice, cell (amide I), and sucrose for the cell used for analysis. (B) Binary image showing the location of white arrow used to illustrate sucrose concentration. (C) Normalized sucrose concentration obtained along the white arrow in panel B.
