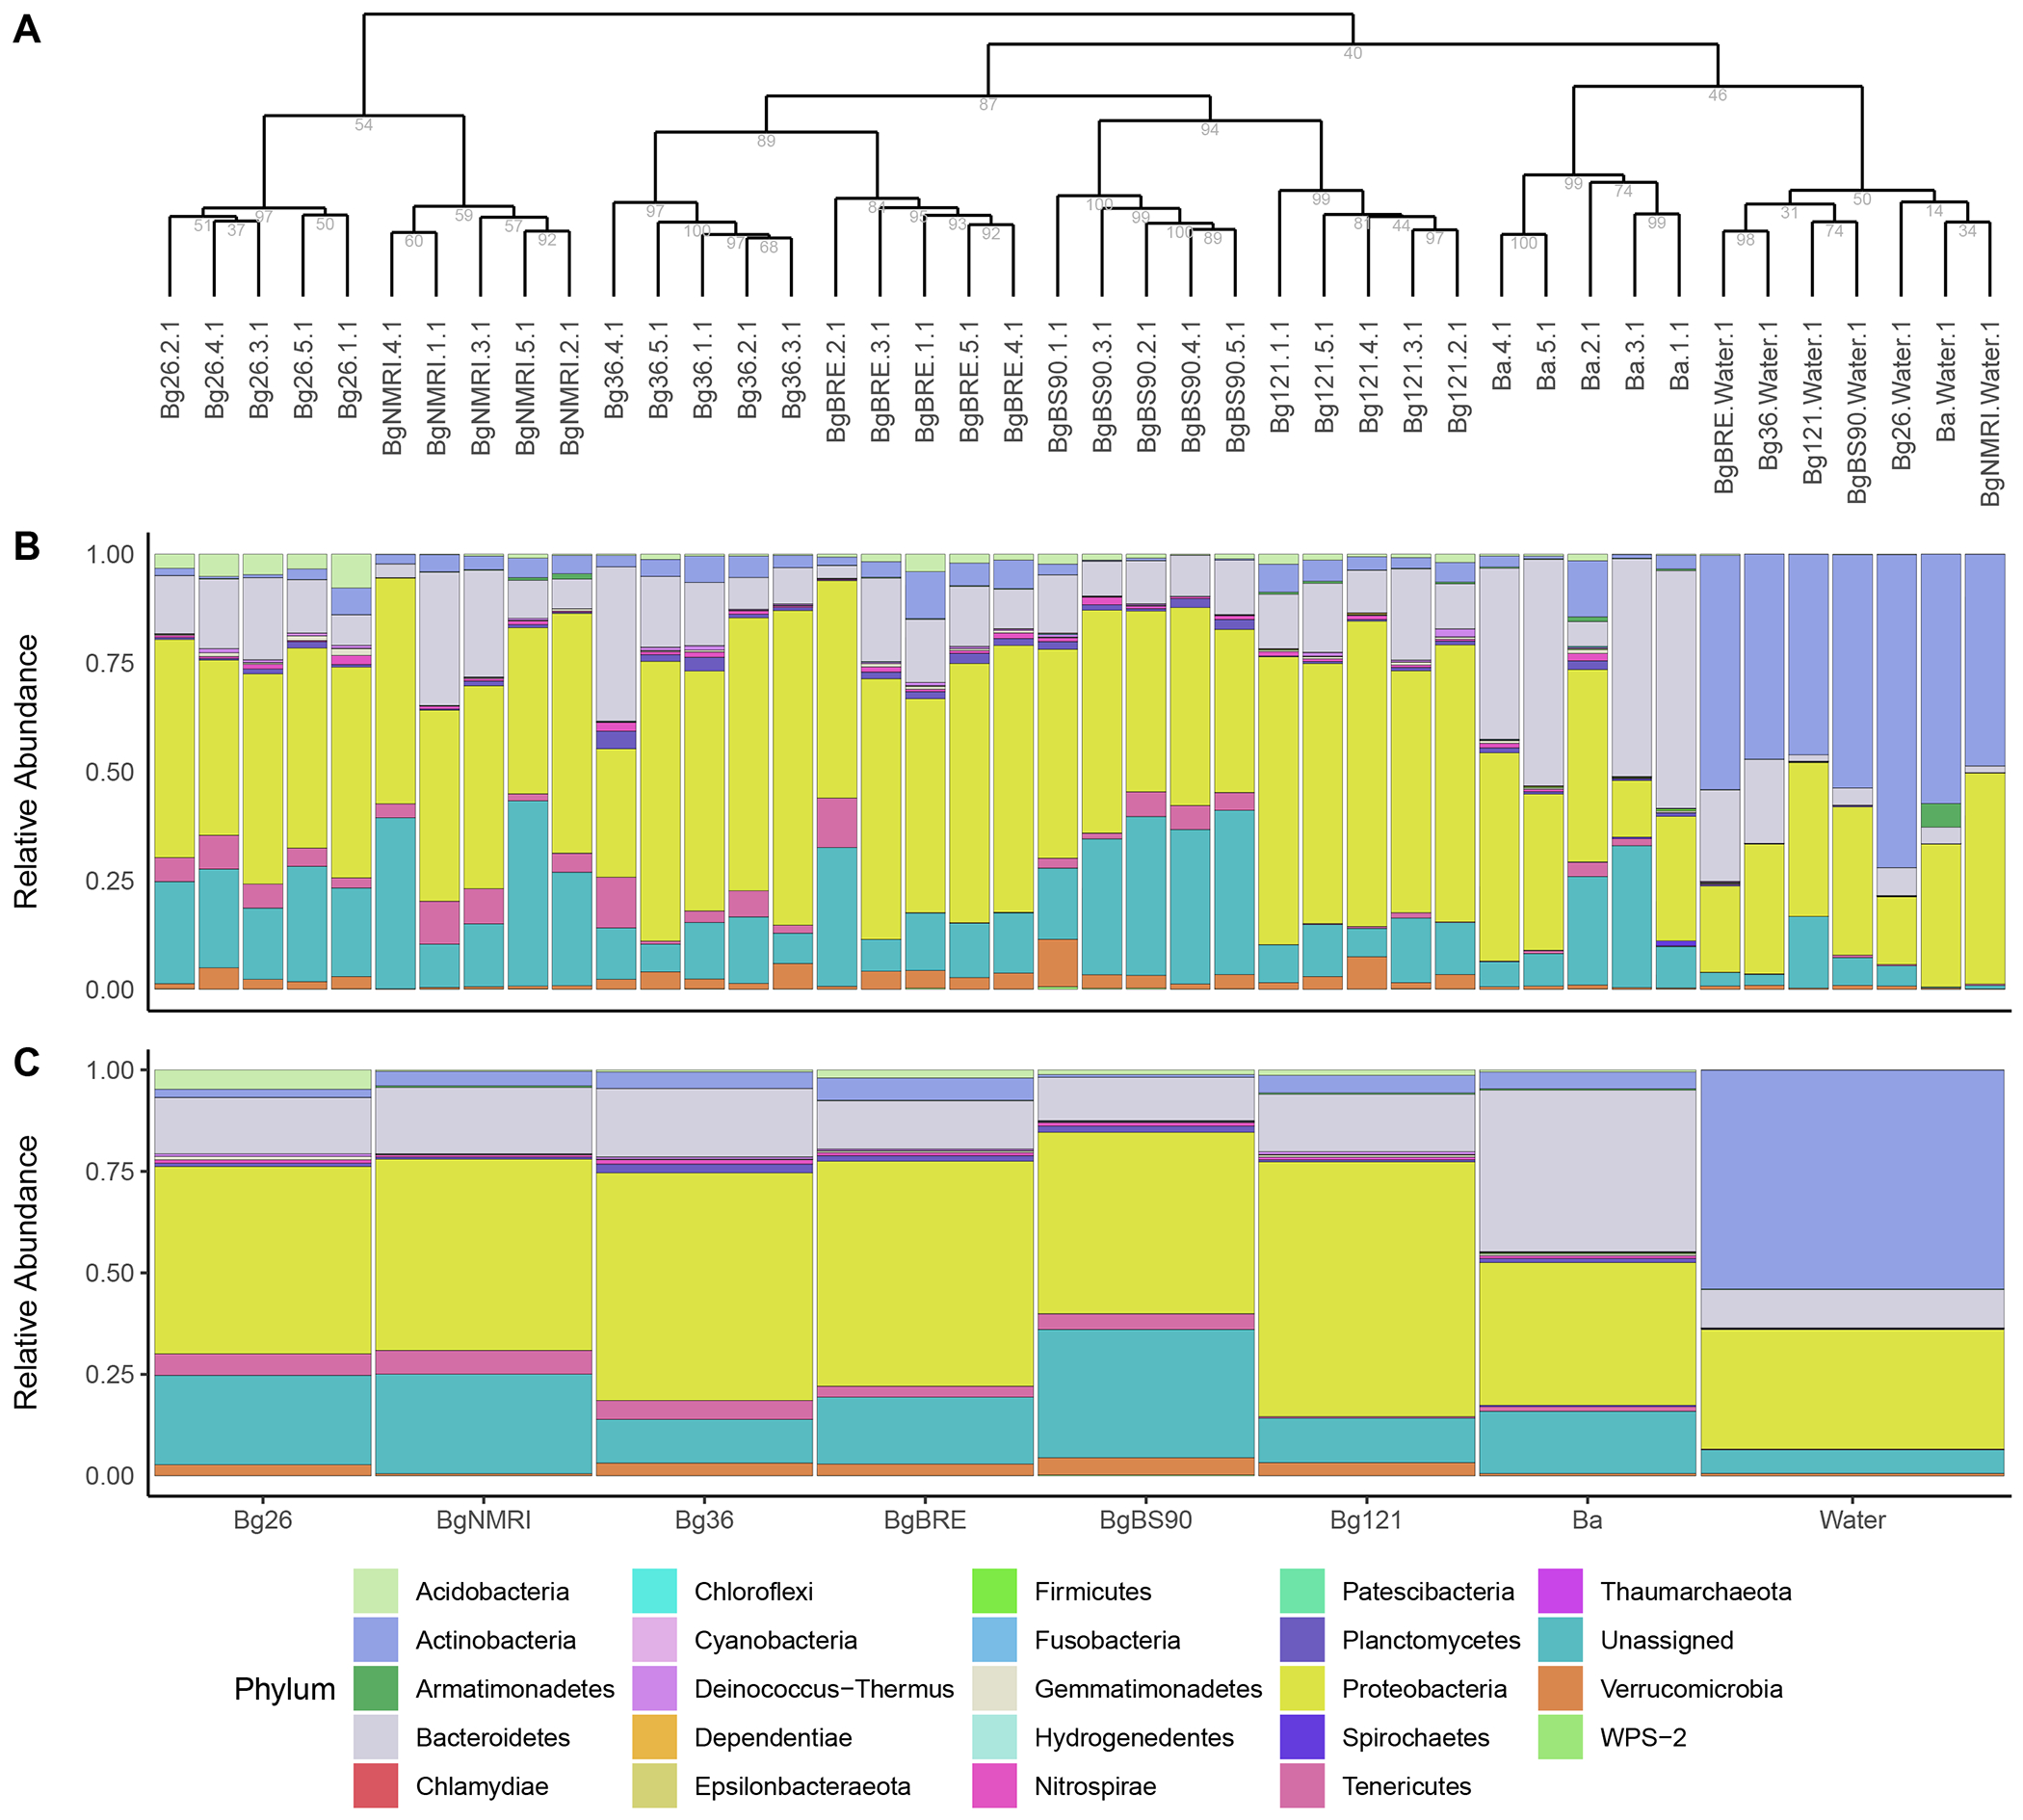
Fig. 4 – Taxonomic diversity in each sample and populations.

A. Dendrogram representing the distance between samples based on their microbiome composition. Number under each node represents bootstrap values from 1,000 iterations. Samples from the same population cluster together and links between populations reflects results obtained from the beta-diversity analyses. B and C. Relative abundance of the different phyla present in each samples from the dendrogram (B) and in each corresponding populations (C). Water microbiome showed dramatic differences when compared to snail hemolymph microbiomes. Snail microbiomes showed also specificities between populations.
