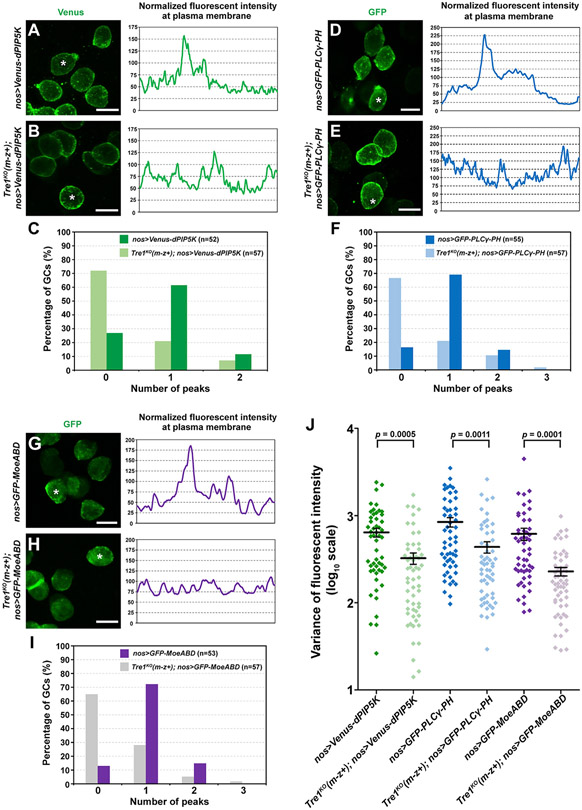
Figure 3. Polarized accumulation of dPIP5K, PI(4,5)P2, and F-actin is lost in Tre1 mutant GCs.
(A–C) Localization of Venus-tagged dPIP5K in WT GCs and in GCs missing maternal Tre1. Scale bars in (A) and (B), 10 μm.
(D–F) Localization of GFP-tagged PI(4,5)P2 sensor (the PH domain of PLCγ) in WT GCs and in GCs missing maternal Tre1. Scale bars in (D) and (E), 10 μm.
(G–I) Localization of GFP-tagged F-actin sensor (the actin binding domain of Moesin) in WT GCs and in GCs missing maternal Tre1. All GCs are from stage 11 embryos. Trace to the right of each confocal image is from a single cell from each sample (asterisk). Counting of the peak numbers in the fluorescent intensity is shown in (C), (F), and (I). Scale bars in (G) and (H), 10 μm.
(J) The variance of fluorescent intensity to quantify polarized distribution of each marker on PM in each genetic background—at least four to six embryos per genotype were scored with a minimum of 50 total GCs. Mean and SEM are shown.
See also Figure S5.

