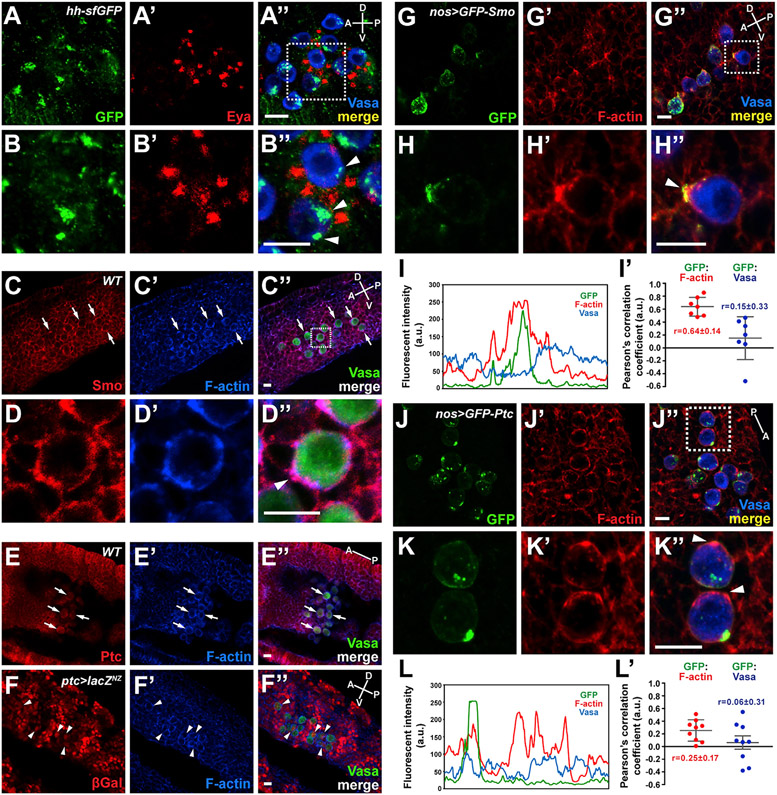
Figure 5. Hh uptake and Smo localization in migrating GCs.
(A–B″) GFP-tagged Hh protein, expressed under the control of its endogenous promoter in a Bac transgene, is stained with anti-GFP antibody (green) (A and A″). Nuclear Eya (red) (A′ and A″) and cytoplasmic Vasa (blue) (A″) staining indicate SGPs and GCs, respectively. A GC boxed in (A″) is magnified in (B)–(B″). Arrowheads in (B″) indicate Hh proteins internalized and accumulated in GCs. Scale bars, 10 μm.
(C–E) Smo and Ptc are expressed in migrating GCs. Immunostaining with anti-Smo (C) or anti-Ptc (E) antibody reveals the presence of Smo and Ptc proteins in GCs. A GC boxed in (C″) is magnified in (D)–(D″) and shows colocalization of Smo and F-actin at the protrusion (arrowhead in D″). Note the segmented staining patterns with both antibodies through the embryos showing the developmental expression patterns of these Hh pathway components. Arrows indicate representative GCs showing Smo (C) or Ptc (E) expression. Scale bars, 10 μm.
(F–F″) Expression of the ptc-Gal4 shown by UAS-lacZ expression, which reports on canonical Hh signaling. A subset of migrating GCs exhibits lacZ expression shown by anti-β-Galactosidase antibody staining (arrowheads in F–F″). Scale bars, 10 μm.
(G–H″) GFP-Smo (green) and F-actin (red) colocalize to the leading edge of migrating GCs. Scale bars, 10 μm.
(I and I′) The line scan of fluorescent signals on the entire GC circumference in (H″) and the Pearson’s correlation coefficients between fluorescent signals from GCs in (G″).
(J–K″) GFP-Ptc (green) and F-actin (red) do not colocalize. Scale bars, 10 μm.
(L and L′) The line scan of fluorescent signals on the entire GC circumference (the cell at bottom) in (K″) and the Pearson’s correlation coefficients between fluorescent signals from GCs in (J″).
GCs boxed in (G″) and (J″) are shown in magnified views in (H)–(H″) and (K)–(K″), respectively. The A-P (dorsal view) and A-P/D-V axes (lateral view) are indicated. All GC images are from stage 11 embryos.

