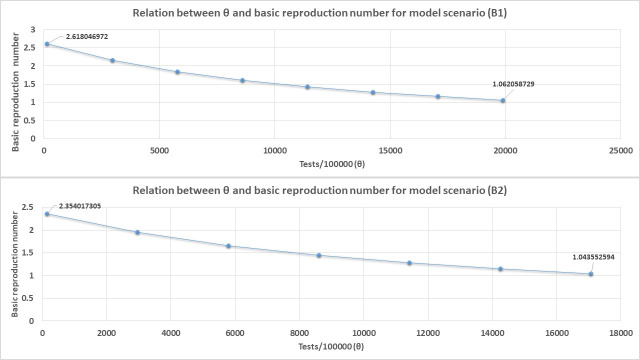
Fig 9.
The relation between R0 and θ (daily blanket testing rate) for model scenario B1 and B2 when blanket testing alone is applied for diagnosis and isolation of all COVID-19 cases. For demonstration purpose only of the direction of the relationship between R0 and θ, an average value of β is used for both scenarios B1 and B2 in Fig 9 given as average β = (β + 0.5β)/2 since these scenarios consist of symptomatic and asymptomatic individuals considered to be transmitting the infection at different rates.

