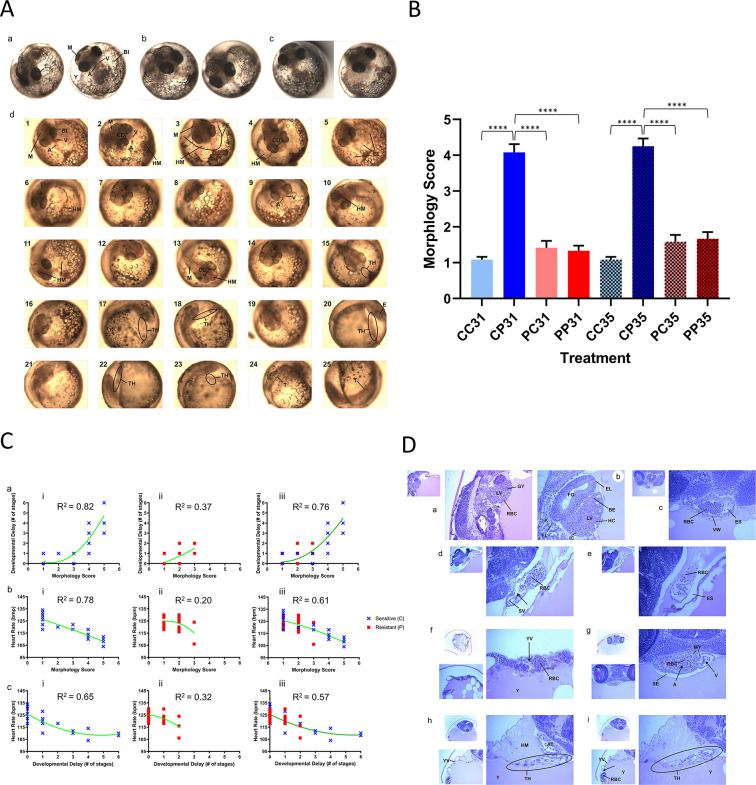
Fig 3. Embryo morphology and developmental delay–heart rate–morphology correlations of sensitive and resistant embryos exposed to clean and polluted sediment extract.
(A) Embryo Morphology at stage 31. a–normal CC embryo; b–normal PC embryo; c–normal PP emryo; d–progression of deformities among exposed sensitive embryos: 1–5 = mildly deformed (score 2); 6–10 –moderately deformed (score 3); 11–16 –severely deformed (score 4); 17–25 = extremely deformed (score 5). A–atrium; BI–blood island; E–eye; CD–cranial deformity (reduced cranial width and eye distance, diminished cranial ridges); HM–hemorrhage; M–melanin; PE–pericardial edema; T–tail; TH–tube heart; V–ventricle. The most severe morphological abnormalities were noted among all sensitive embryos exposed to polluted sediment extracts (N = 12 / treatment group). (B) Embryo deformity assessment among sensitive (blue) and resistant (red) embryos exposed to clean and polluted sediment extracts. One-way ANOVA (p < 0.01) and Bonferroni post-test (p < 0.01) revealed statistical differences between CP embryos and all other treatment groups. The average morphological score for sensitive embryos raised on clean extracts (CC) was 1.083 for both stages 31 and 35: almost all of the sensitive embryos developed normally. Except for the CP treatment group, there were no significant differences in morphology scores between CC embryos and other treatment groups. Significantly deformed sensitive (CP) embryos were severely or extremely deformed (score 4 and 5) due to exposure to polluted ER sediment extracts, with average scores of 4.083 (stage 31), and 4.250 (stage 35). ****, p < 0.0001. (C) Morphology scores, heart rate, and stage delays are correlated among sensitive embryos exposed to PAH-polluted sediment extracts. Green curves are regression lines indicating the correlation between the specified variables; corresponding R2 values, coefficients of determination, represent the strength of the correlations. a: Developmental Delays–Morphology, b: Heart Rate–Morphology, and c: Heart rate–Developmental Delays correlations among i) sensitive embryos, ii) resistant embryos, iii) both embryo populations. bi) shows as sensitive embryos become more deformed and their morphology scores increase, their heart rates significantly decreased (R2 = 0.78); ai) shows morphological deformities also caused significant development delays (R2 = 0.82), characterized by ci) altered heart rate (R2 = 0.65). (D) Histopathology of stage 31 sensitive and resistant embryos exposed to clean and polluted sediment extract. Histological abnormalities were detected only in sensitive embryos exposed to contaminated sediments. The most prevalent alterations are observed in heart development (70% of embryos, N = 8) and minor alterations in liver and kidney tissues (40%, N = 5). a, b–Liver and Kidney; c–Ventricular Wall; d–Atrium; e–Tube Heart; f–Yolk Vein Vascular Alterations and Yolk Sac Hemorrhage; g–Atrio-Ventricular Alterations; h, i–Tube Heart. A, AT–atrium, BE–biliary epithelial cells, El–epithelial cells; ES–effusion; FG–foregut; GY–glycogen; HC–hepatocytes, HM–Hemorrhage, IC–Ito cells, K–kidney, LV–liver, MY–myocytes, RBC–red blood cells, SE—subendothelium, SV–subendothelial vacuolation, TH–tube heart, Y–yolk, YV–yolk vein, VW–vessel wall.

