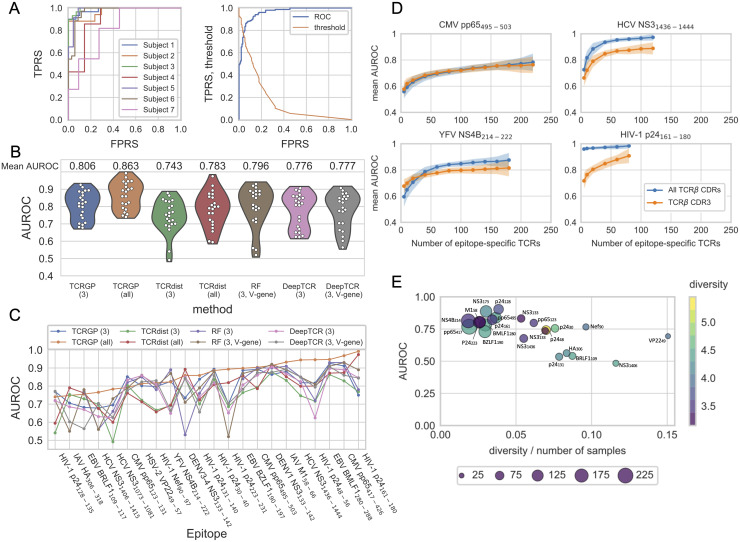
Fig 3. Epitope specificity prediction with the VDJdb data.
(A) The left panel shows the cross-validated ROC curves for each subject in the VDJdb data for HCV NS31436-1444-epitope, when TCRGP has been trained using TCRα and TCRβ with all CDRs. The mean AUROC score is 0.944. The right panel shows the cross-validated ROC curve for all subjects and also the threshold values for classification are shown. From this figure we can determine which threshold values correspond to different true positive rates (TPRS) and false positive rates (FPRS). (B) One violin plot presents the distribution estimate of mean AUROC scores obtained with one method for all epitopes in our VDJdb data. Below each violin plot there is the name of the method used and in the brackets which CDRβs have been used (3 for CDR3, all for CDR1, CDR2, CDR2.5, and CDR3). Each point within a violin plot presents the mean AUROC score obtained for one epitope. RF refers to the Random Forest TCR-classifier of De Neuter et al. [19]. RF using only CDR3β has not been included in this figure as it could not provide predictions for all of the 22 epitopes. (C) Comparison of AUROC scores obtained with the different methods for each epitope separately. The epitopes have been arranged in increasing order of AUROC scores obtained by TCRGP using all CDRβs (orange line) (D) For each epitope from the VDJdb dataset, TCRGP models were trained using different numbers of unique epitope-specific TCRβs, always complemented with the same number of control TCRβs. For each point of the learning curve the model was trained with 100 random samples of the TCRβs, using either CDR1, CDR2, CDR2.5, and CDR3 (blue curves), or only CDR3 (orange curves). The darker lines show the mean of the predictions and the shaded areas ± the standard deviation for the 100 folds. The points indicate the tested sample sizes. Here learning curves for four peptides are shown. (E) Leave-one-out cross-validated AUROC scores correlate with the diversity and number of samples (Pearson correlation -0.66). The sizes of the circles indicate the number of unique TCRs used for training.

