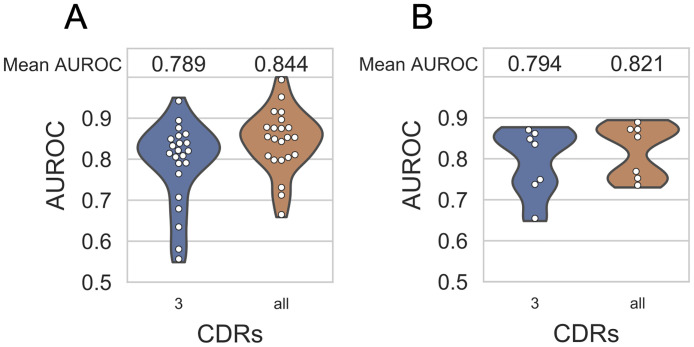
Fig 4. Mean AUROC scores obtained from TCRGP models with different kinds of data.
Blue violin plots show results of models trained with only CDR3β and orange violin plots of models trained with all CDRβs. (A) Mean AUROC scores from TCRGP models for the 22 epitopes in VDJdb data, when TCRs specific to one epitope are considered as positive and TCRs specific to the other 21 epitopes are considered as control data. 200-fold stratified cross validation was used for the evaluation. (B) Same as (A), but only the 885 unique TCRs specific to the seven HLA-A*02 restricted epitopes are used.

