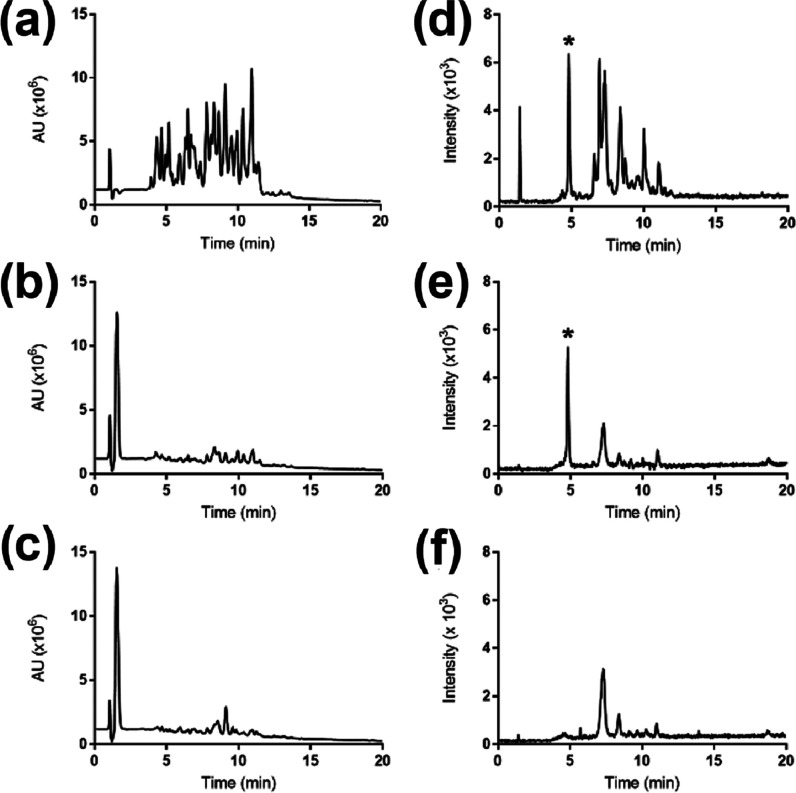
Figure 5.
HPLC-UV chromatograms (a–c) and corresponding ESI-MS selective ion monitoring (SIM, m/z = 447.5) spectra (d–f) of the sample before enrichment (a, d) and elution fractions from MIP1 (b, e) and NIP1 (c, f). The VpHI peptide (0.2 μmol) was spiked in BSA (1 μmol) digest. The signal from VpHI is marked with an asterisk.

