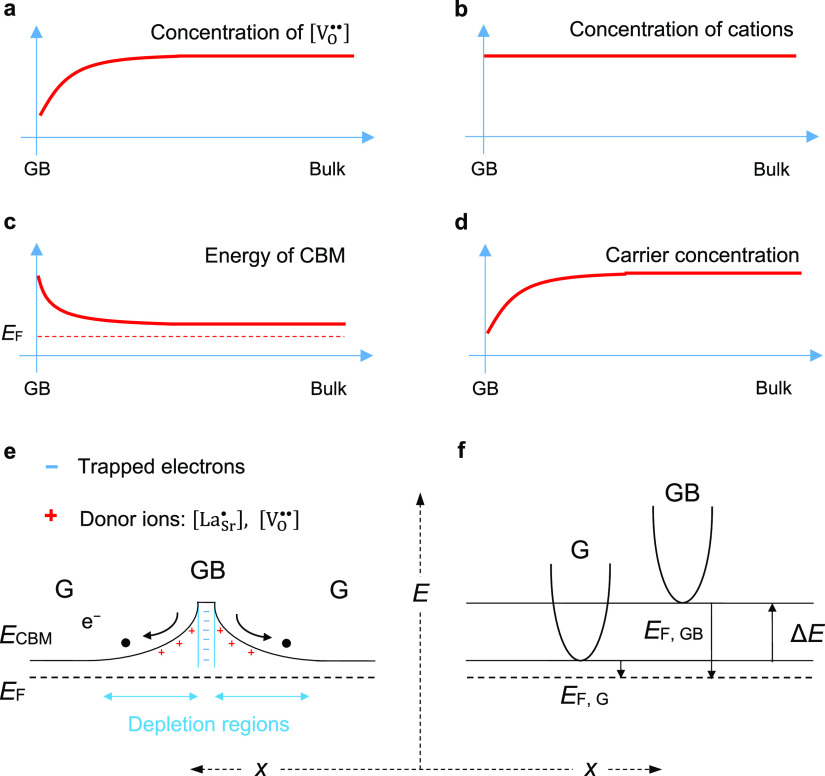
Figure 1.
Diagrams showing that (a) concentration of oxygen vacancy is lower near the GB compared with the bulk grain, (b) concentrations of cations remain across the GB, (c) CBM bends upward because of the equilibrium of the Fermi energy level, and (d) reduced concentration of the free carrier at the vicinity of the GB. (e) Schematic illustration of the potential barrier across the GB, G represents a neutral grain and the black dots and arrows represent the transport of free electrons being inhibited by the GB barrier. (f) Schematic illustration of the two-phase model for the band offset (ΔE) in the GB phase.

