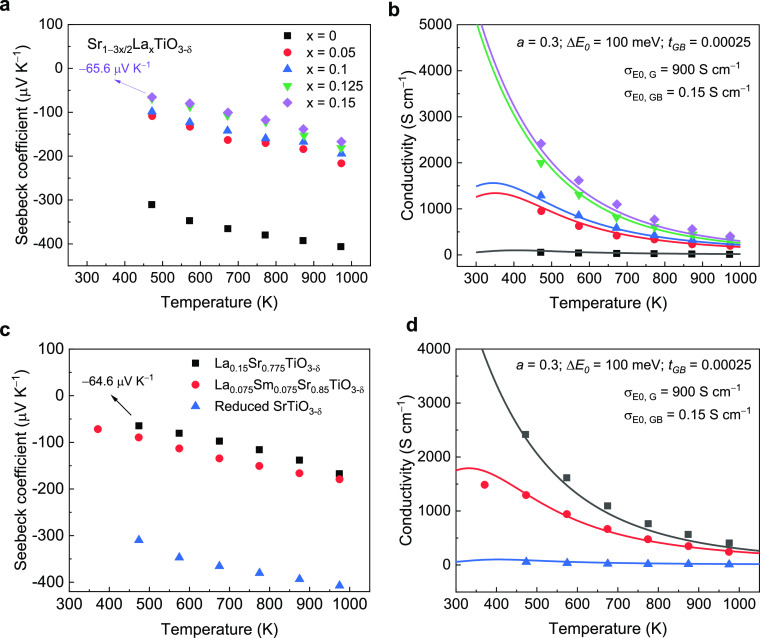
Figure 3.
Fitting of the measured carrier transport results from the literature using the two-phase model. Experimental data points are displayed as symbols, and the modeled results are shown as solid lines. Data points for Seebeck coefficients (a) and electrical conductivity (b) are from the work of Lu et al.36 Data points for the Seebeck coefficient (c) and electrical conductivity (d) are from Boston et al.18

