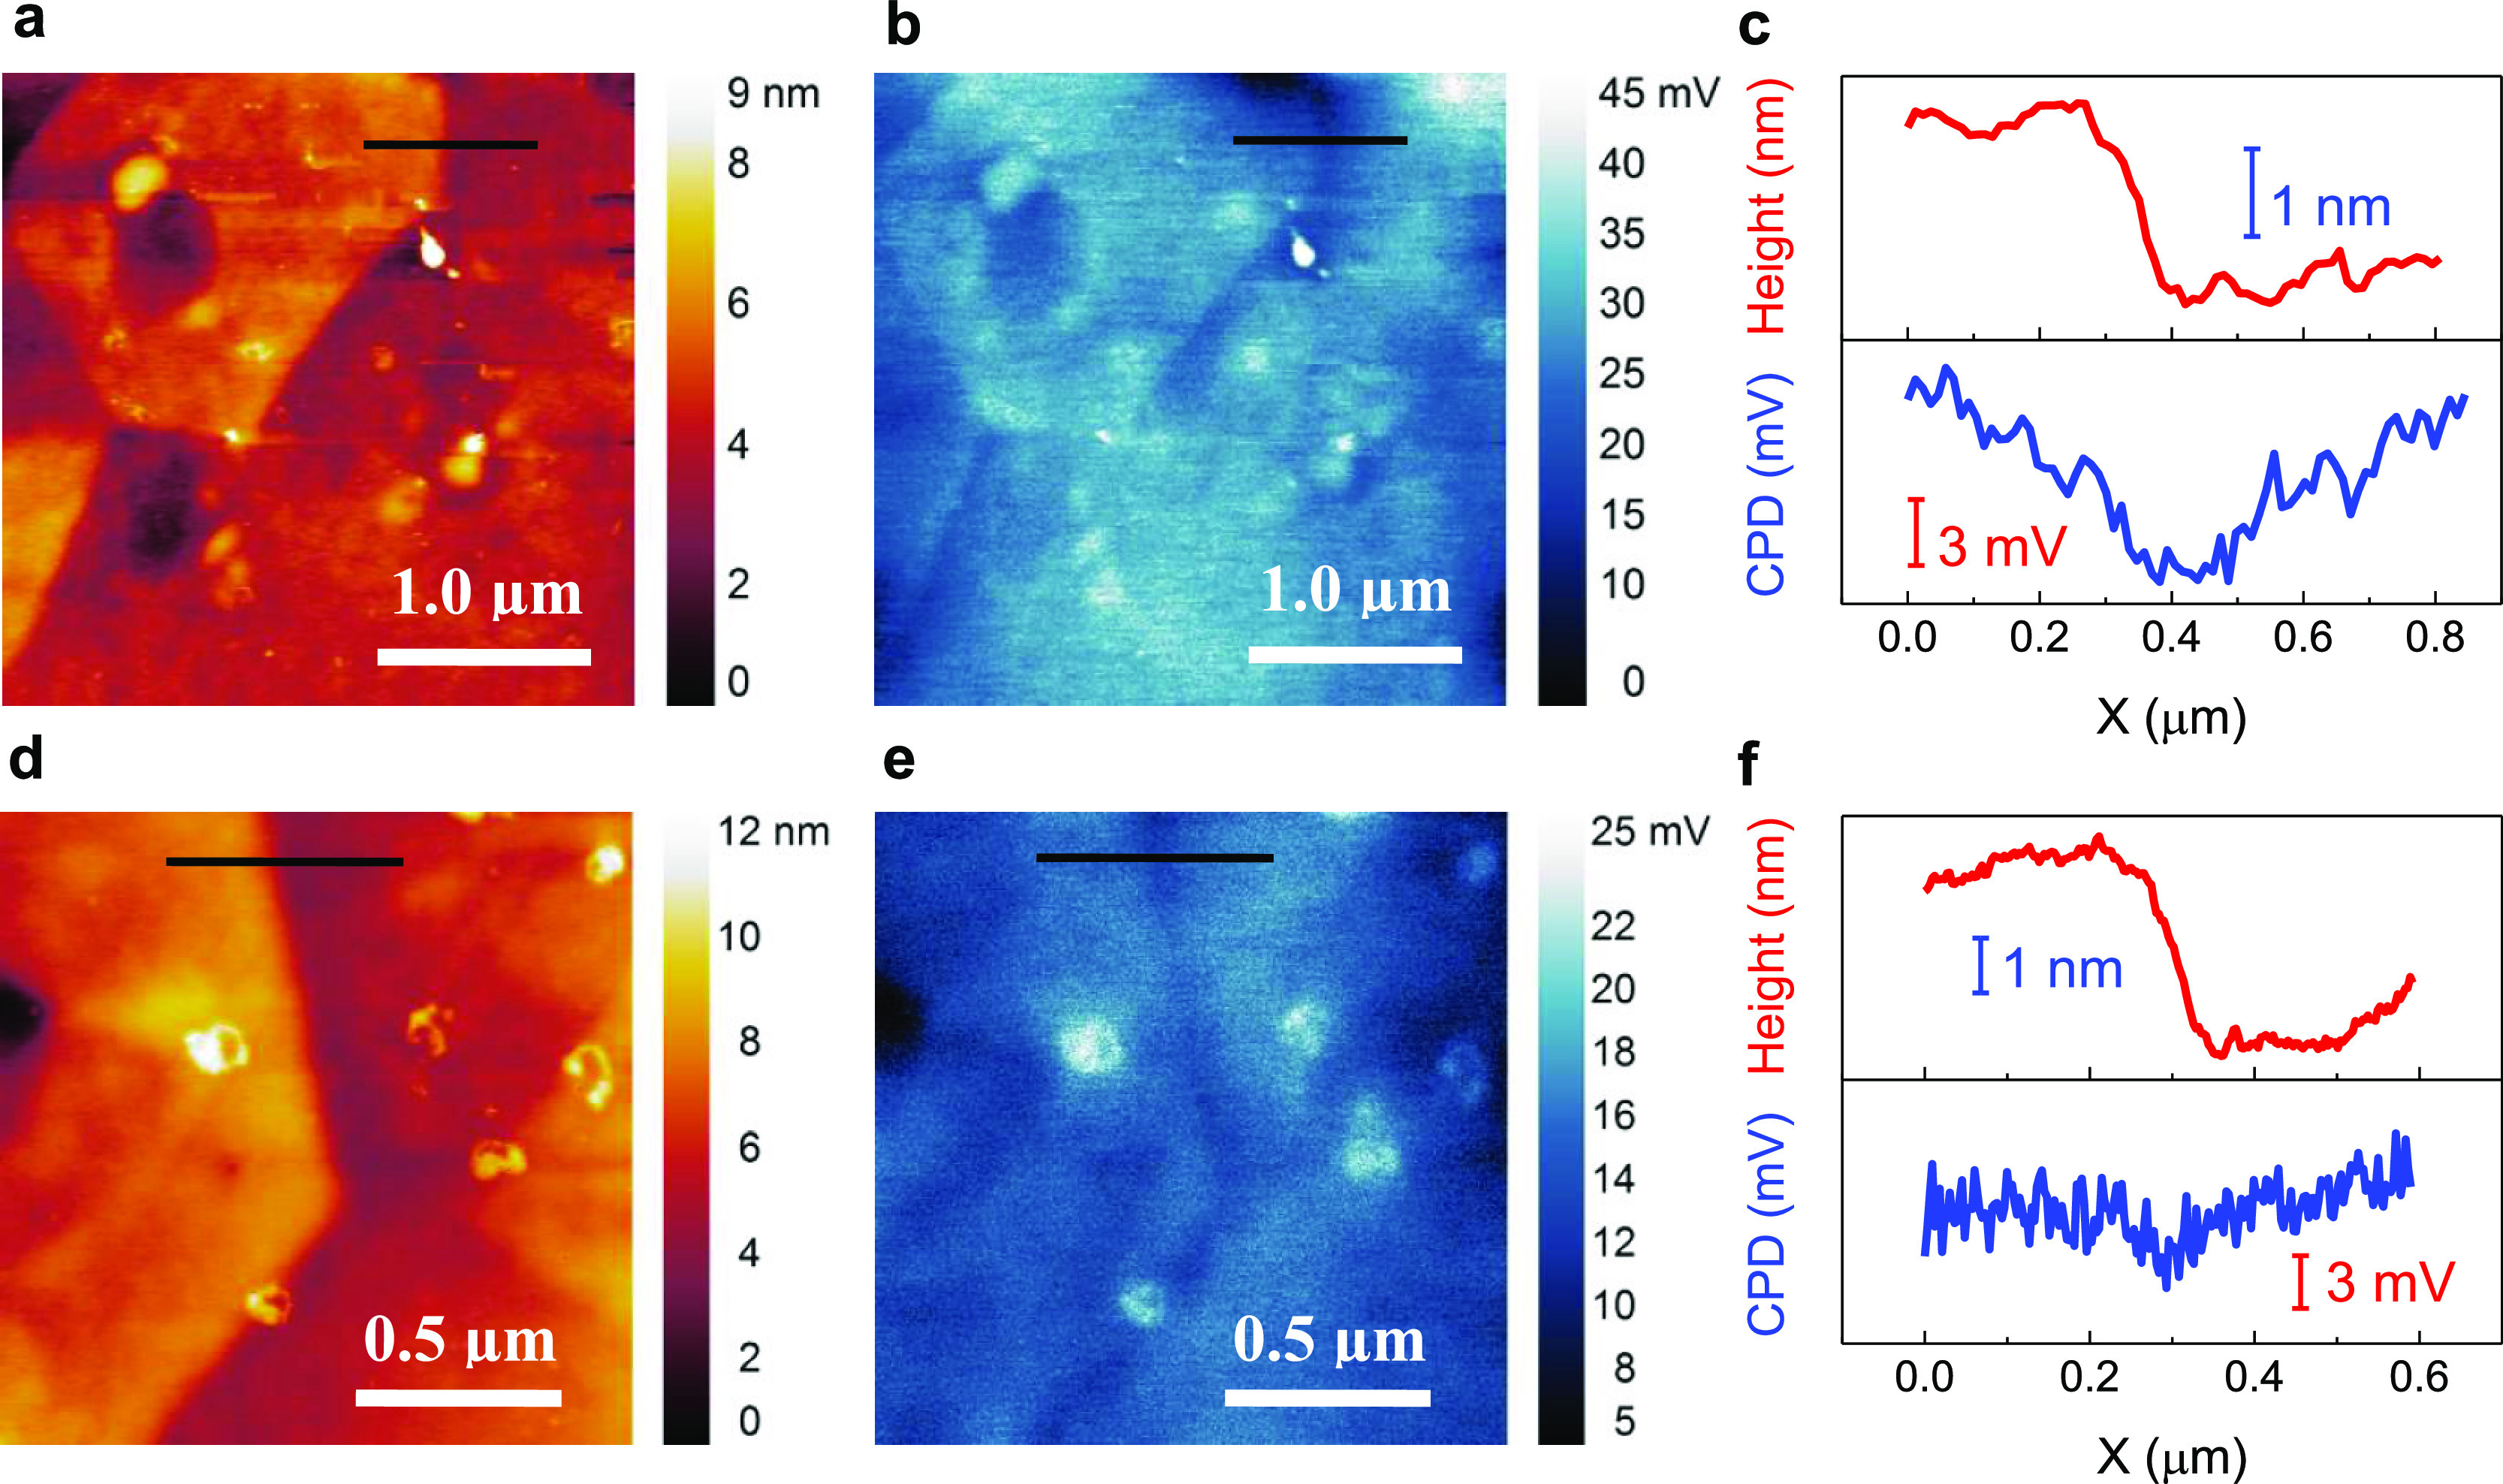
Figure 7.

AFM and KPFM characterization for the LSTO-H2 and LSTO-H2-in-C samples. (a) AFM height and (b) the corresponding CPD images for the LSTO-H2 sample with high GB potential; (c) extracted height (upper panel) and CPD (lower panel) profiles for the black lines marked in (a,b), respectively. (d) AFM height and (e) the corresponding CPD images for the LSTO-H2-in-C sample with low GB potential; (f) the extracted height (upper panel) and CPD (lower panel) profiles for the black lines marked in (d,e), respectively.
