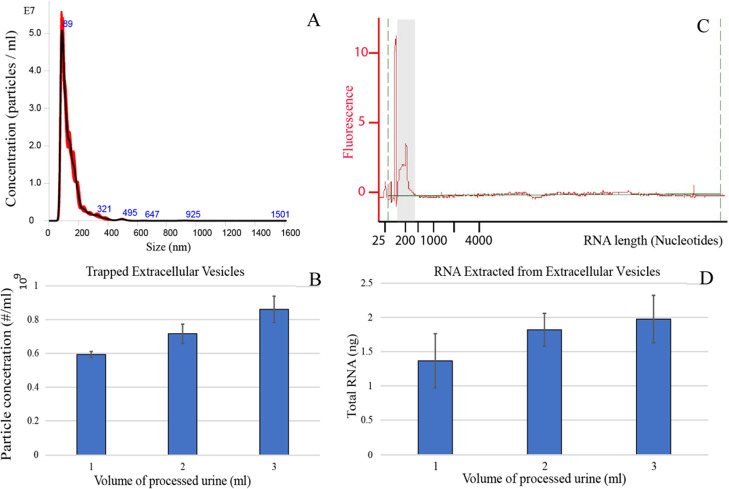
Figure 6.
Extracellular vesicle trapping from 1, 2, and 3 mL of the urine samples. The flow rate was fixed at 500 μL/min for all samples. (A) The size distribution of particles from 3 mL of trapped urine with a vesicle peak at 89 nm. (B) Particle concentration in the eluted fraction of EVs from the NTA measurements for varying volumes of the input sample. Background from PBS has been subtracted. (C) The length distribution of intravesicle RNA from trapped vesicles expressed in the number of nucleotides. The first and the highest peaks represent the nucleotide reference ladder that was added to calibrate the system and should be ignored. The vesicle-derived RNA is seen in the peak around 200 nucleotides in length, highlighted in the gray zone. (D) The average total amount of RNA extracted for each input volume of urine.

