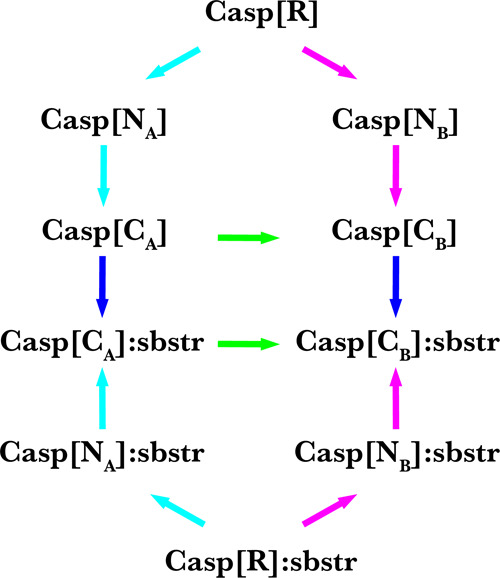
Figure 3.

Thermodynamic cycle to calculate meaningful relative binding free energies from OSP of a reference state (R) and third-power fitting between neutral (N) and charged (C) states. Free energies along the black arrows were calculated from the simulations (OSP: R → N; TPF: N → C). Free energies along the blue arrows are binding free energies between the Caspase-2 (Casp) and its substrate (sbstr). The free-energy differences along the green arrows can be calculated from the differences between the cyan and magenta arrows. Relative free energies between the mutants (A,B) of the protein can be calculated from the difference between the two green arrows. The free-energy difference between the two green arrows (non-physical path) is the same as between the two blue arrows (physical path).
