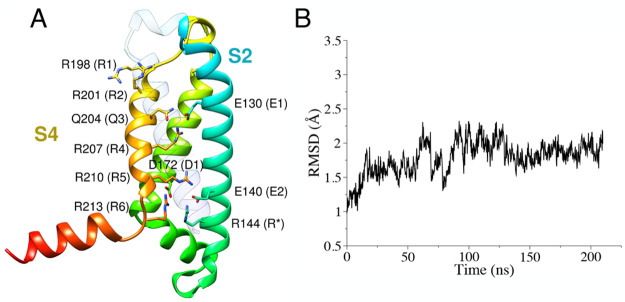
Figure 2.
(A) hKv7.2 VSD structural model, represented as ribbons colored from blue (N-terminus) to green to red (C-terminus). The S1 helix is left transparent for clarity. Side chains of relevant residues are represented as sticks. (B) Backbone RMSD values of the TM α-helices for the VSD model in the heterogeneous membrane.

