Figure 3.
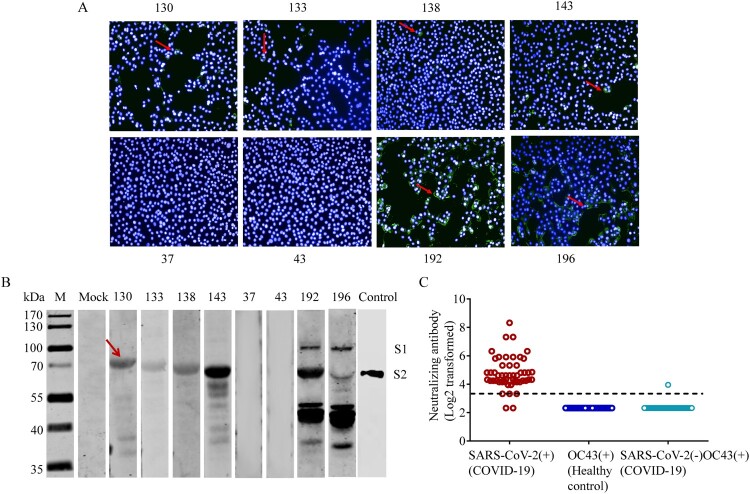
Cross-reactivities between SARS-CoV-2 and HCoV-OC43 S-IgG. (A–B) Cross-reactivities between HCoV-OC43 S-IgG and SARS-CoV-2 in indirect immunofluorescence assays (IFAs) (A) and Western blot assays (B). Vero cells infected with SARS-CoV-2 at a MOI of 0.1 were probed with plasma positive for HCoV-OC43 S-IgG from healthy donors (sample ID: 130, 133, 138, and 143). Plasma samples negative for HCoV-OC43 antibodies were used as negative controls (sample ID: 37 and 43). Plasma from COVID-19 patients were used as positive controls (sample ID: 192, 196). Control (in panel B): The S2 subunit were verified using a monoclonal antibody against SARS-CoV-2 S2 subunit (Control). The red arrows in panel (A) indicate Vero cells that can reacted with plasma samples positive for HCoV-OC43 or SARS-CoV-2. The red arrows in panel (B) indicate the S2 subunit of S protein. (C) Cross-neutralization between SARS-CoV-2 and HCoV-OC43 S-IgG. Neutralizing antibodies (NAbs) were measured using HCoV-OC43 S-IgG positive plasma from 50 unexposed healthy controls, and HCoV-OC43 S-IgG positive but SARS-CoV-2 S-IgG negative plasma from 50 COVID-19 patients by microneutralization assay with a SARS-CoV-2 isolate (IPBCAMS-WH-01/2019 strain). SARS-CoV-2 S-IgG positive plasma samples from 50 COVID-19 patients were used as positive control. Dashed line represents the cut-off value of NAb titres.

