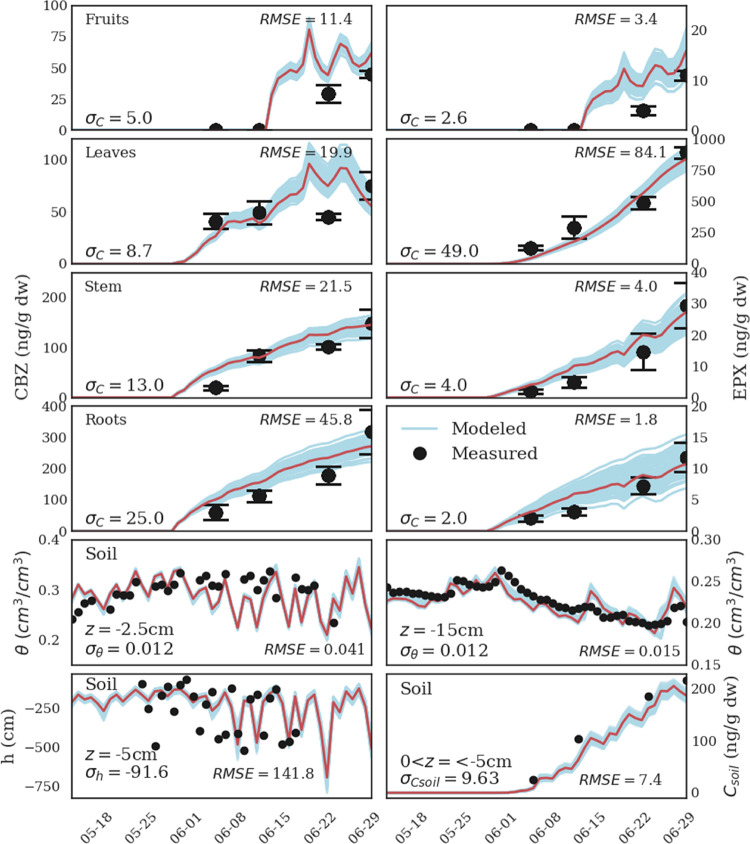
Figure 1.
Comparison between the measured (black circles) CBZ (left column) and EPX (right column) concentrations in different plant’s compartments, CBZ concentration in soil (0 < z < −5 cm), pressure heads (z = −5 cm), and volumetric water contents (z = −2.5 and −15 cm), and corresponding modeled values (blue lines) obtained by random sampling of 100 solutions from the posterior parameter distributions. The error bars indicate the standard deviations of the measurements. The red line indicates the model predictions obtained by using the median solution reported in Table 1. The mean standard deviation used in the Bayesian analysis (σ) and the median root mean square error (RMSE) are reported in each subplot.

