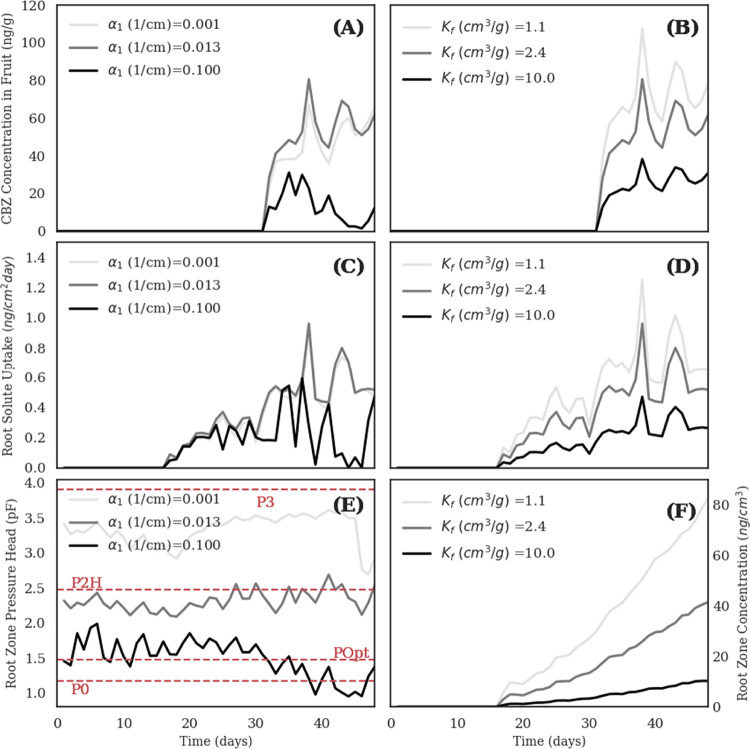
Figure 2.
Sensitivity analysis results. (A) and (B) Simulated CBZ concentrations in the fruits as a function of α and Kf, respectively. (C) and (D) Simulated root solute uptake as a function of α and Kf, respectively. (E) Simulated average pressure head (pF = log(|h|) in the root zone as a function of α. (F) Simulated average CBZ concentrations in the liquid phase in the root zone as a function of Kf. The red dashed lines indicate the Feddes’ parameters (Table 1). The plots were obtained by performing numerical simulations with three different values of α1 and Kf. In particular, the median solution reported in Table 1 was used as a reference, and only the values of α1 and Kf were alternatively changed to match the minimum and the maximum listed in Table 1.

