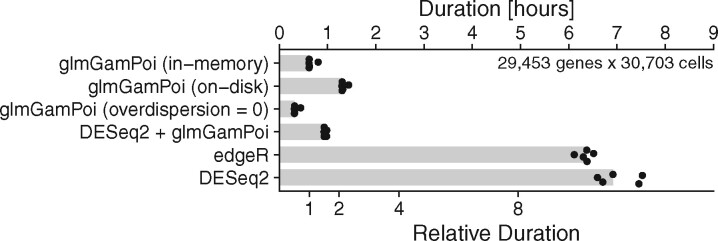
Fig. 1.
Bar plot comparing the runtime of glmGamPoi (in-memory, on-disk and without overdispersion estimation), edgeR and DESeq2 (with its own implementation, or calling glmGamPoi) on the Mouse Gastrulation dataset. The time measurements were repeated five times each as a single process without parallelization on a different node of a multi-node computing cluster with minor amounts of competing tasks. The points show individual measurements, the bars their median. To reproduce the results, see Supplementary Appendix S2

