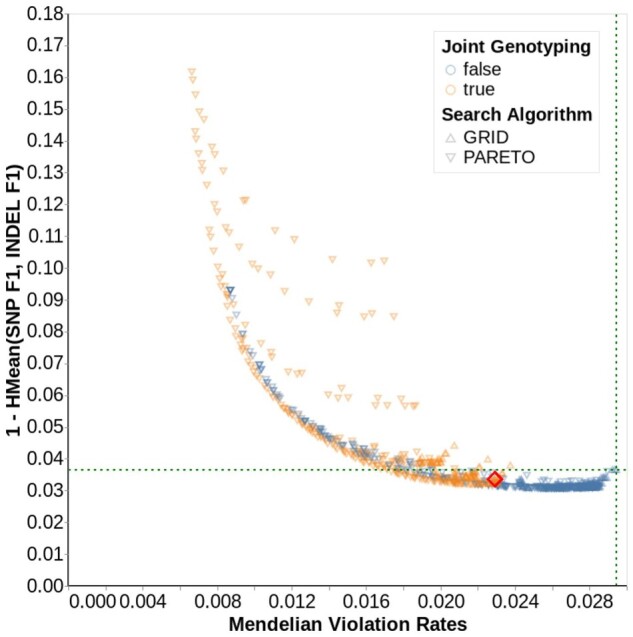
Fig. 2.

Parameter search for n = 1247, 15× cohort. Each data point represents a unique parameter combination explored by Vizier. The color indicates whether the GLnexus parameter to revise genotypes was true (orange) or false (blue), and the shape represents the search algorithm. The x-axis indicates Mendelian violation rate. The y-axis indicates errors on GIAB through the harmonic mean of SNP F1 and indel F1 (lower is more accurate). Points toward the lower left are more accurate on both metrics. The intersection of the green horizontal and vertical dotted lines indicates the performance using GLnexus with no variant modification (Supplementary Table S4). Supplementary Figure S5 shows the results for all cohort sizes and coverages. The red diamond indicates the parameter set we selected for the optimized DeepVariant+GLnexus pipeline
