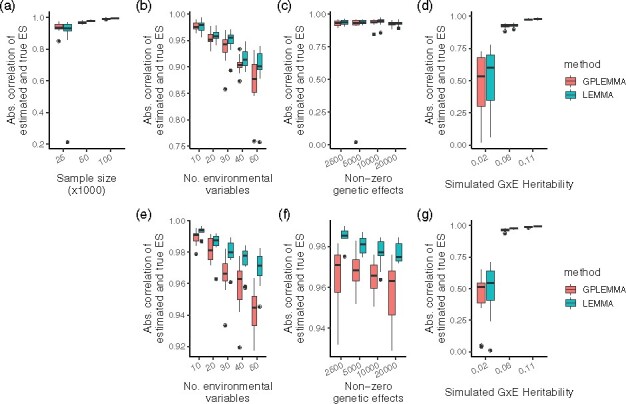
Fig. 2.

Correlation between the true ES and the inferred ES. Absolute correlation between the true ES and the ES inferred by LEMMA and GPLEMMA whilst varying the number of environments, the number of active environments, the number of non-zero SNP effects and GxE heritability. All simulations constructed with the baseline phenotype. a–d Simulations results using samples and variants by default, e–g simulation results using samples and variants. Results from 15 repeats shown
