Figure 5.
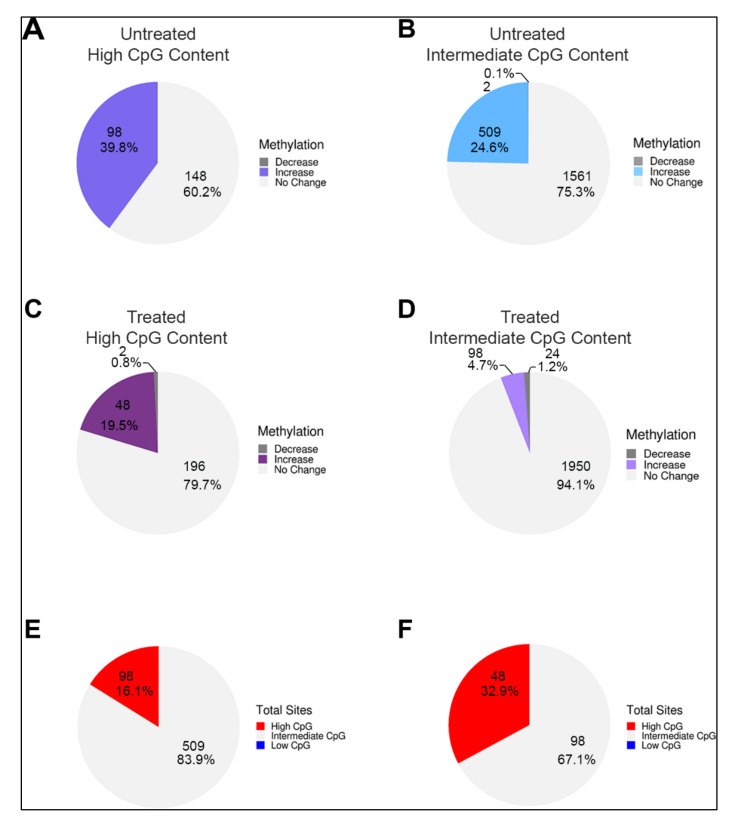
Frequency of DNA methylation correlated with CpG content of PpGes. LSD1-bound PpGes were sorted based on high and intermediate/low CpG content. Pie charts showing change in DNA methylation in untreated cells post differentiation in PpGes with (A) high CpG content and (B) intermediate/low CpG content, and in pargyline-treated cells post differentiation in PpGes with (C) high CpG content and (D) intermediate/low CpG content. The data show a 5-fold decrease in the number of PpGes that are methylated post differentiation in (D) compared to (B) and only a 2-fold decrease in (C) compared to (A). Direction of change (increase, no change, or decrease), was determined by normalizing to average methylation change in housekeeping genes. PpGes that get methylated post differentiation in the untreated and treated cells (shown in green and purple areas in the waterfall plot of Figure 3) were sorted based on their CpG content. Pie charts show CpG content of methylated PpGes post differentiation in untreated samples (E) and treated samples (F). DNA methylation gain in PpGes with high CpG content is more resistant to pargyline treatment.

