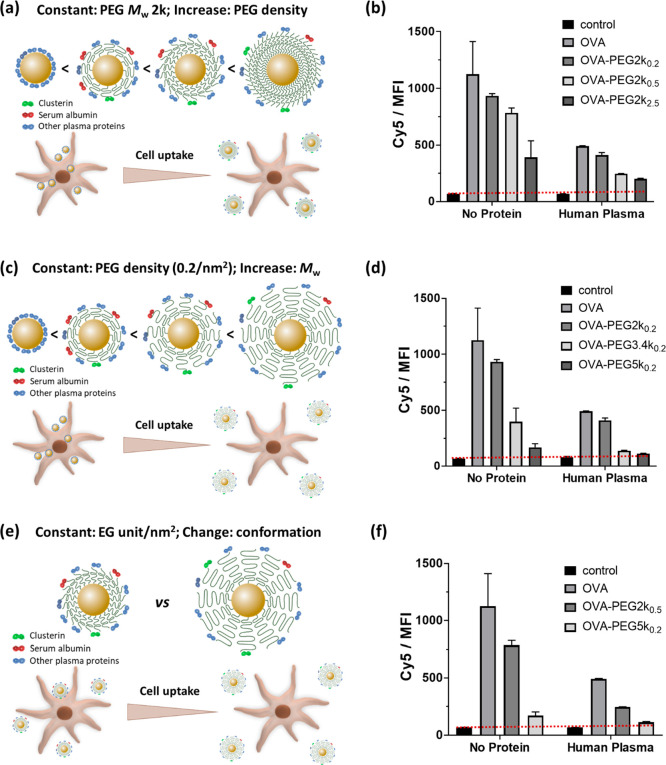
Figure 3.
(a, c, e) Schematic illustration of the correlation between PEG conformation, clusterin density, and cellular uptake and (b, d, f) the cellular uptake results of OVA and OVA-PEG NCs by BMDCs at various PEG molecular weights and surface densities. (a, b) Increasing PEG density at constant molecular weight (2000 g mol–1). (c, d) Increasing molecular weight at constant grafting density (0.2 chains nm–2). (e, f) Constant number of ethylene glycol units per nm2 but with different PEG molecular weights and densities (mushroom–brush intermediate conformation: PEG2k at 0.5 chains/nm2; brush conformation: PEG5k at 0.2 chains/nm2). BMDCs (1 × 10⁶ cells mL–1) were incubated with various PEGylated OVA-NCs in the absence (no proteins) or presence of human plasma proteins (hP) for 4 h. The median fluorescence intensity (MFI) was measured by flow cytometry. Cells treated with non-PEGylated OVA-NCs and untreated cells were used as controls.

