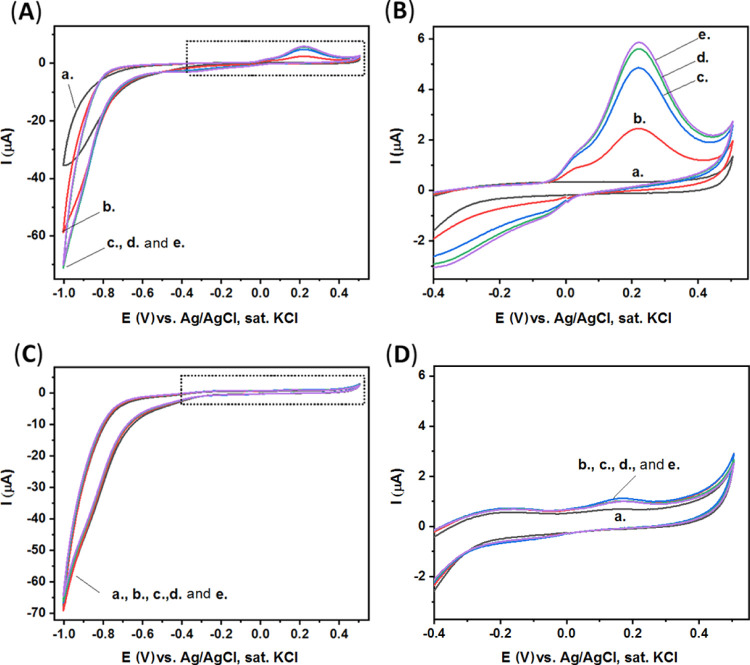
Figure 6.
(A) CV of CPE/BSA fully modified, contains the P. pachyrhizi soybean rust spores, the aptamer, and the AP enzyme: curve (a) in CBS. Curves (b–e) after the addition of p-nitrophenyl phosphate substrate (2 mg in CBS, 5 mL) at different time intervals: 0, 5, 10, and 15 min, respectively. Scan rate, 100 mV·s–1. (B) Expanded dotted area of (A). (C) CV of CPE/BSA: curve a in CBS. Curves (be) after the addition of p-nitrophenyl phosphate substrate (2 mg in CBS, 5 mL) at different time intervals: 0, 5, 10, and 15 min, respectively. Scan rate, 100 mV·s–1. (D) Expanded dotted area of (C).

