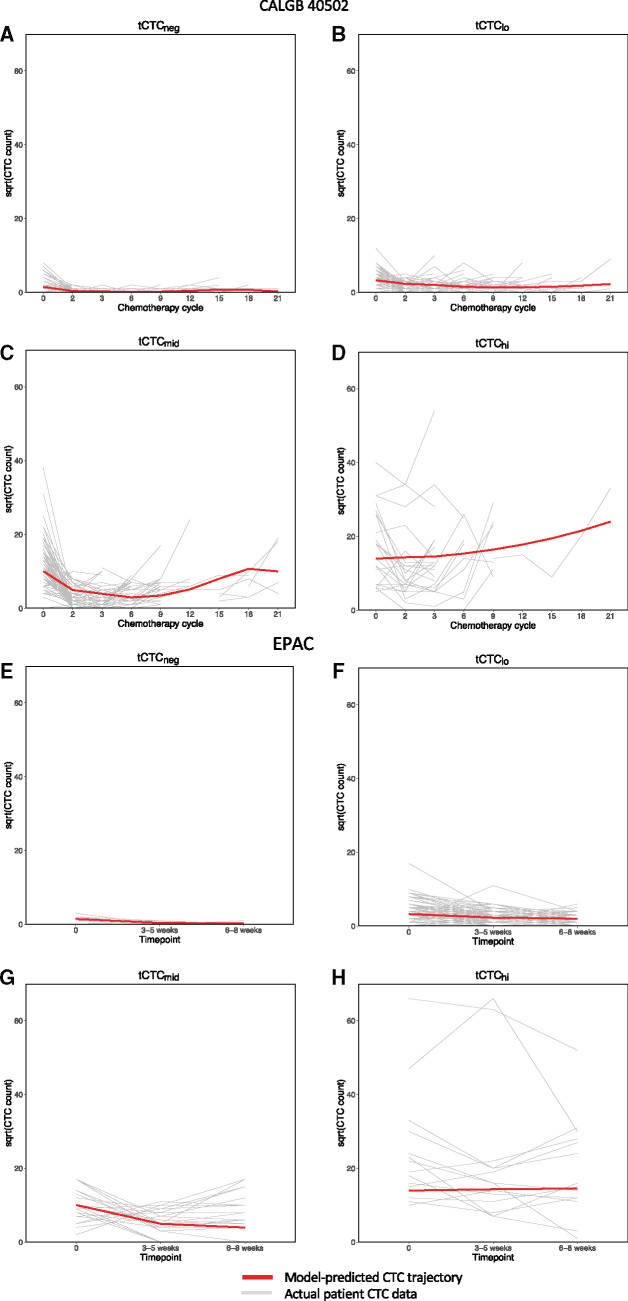
Figure 3.
Circulating tumor cell (CTC) trajectory patterns during therapy. CTCs were counted in individual metastatic breast cancer patients (gray lines) before treatment (time point 0 in the x-axis) and subsequent time points during therapy. A latent mixture model was then built to group patients according to similarities in CTC trajectory (tCTC) patterns over time. This analysis, first performed on serial CTC data from Cancer and Leukemia Group B (CALGB) 40502 patients (A-D), revealed 4 different tCTC patterns (red lines): A) high trajectory for CTCs (tCTCneg), B) low trajectory for CTCs (tCTClo), C) intermediate trajectory for CTCs (tCTCmid), and D) high trajectory for CTCs (tCTChi) groups. For validation, the model was then applied to the European Pooled Analysis of individual CTC (EPAC) dataset (E-H), which also grouped patients into 4 tCTC patterns: E) tCTCneg, F) tCTClo, G) tCTCmid, and H) tCTChi. The y-axis represents the levels of CTCs (square root of CTC per 7.5 mL of blood) in individual patients (gray lines) vs model-predicted CTC trajectories (red lines). The x-axis indicates different time points during therapy: cycles of chemotherapy for CALGB 40502 or time after initiation of treatment for EPAC.

