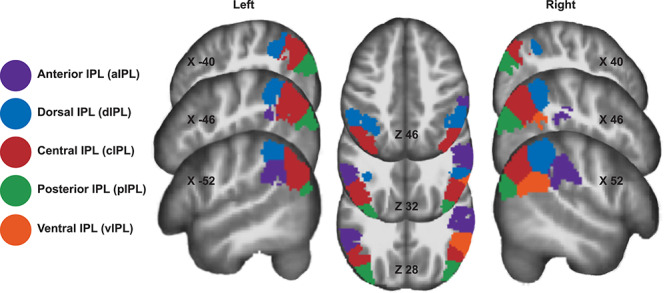
Figure 2.

Parcellation of the IPL showing the subregions generated by constrained independent components analysis. Parcellation map reflects analyses for left and right hemispheres, with subregions colored to reflect similar spatial arrangement across hemisphere.
