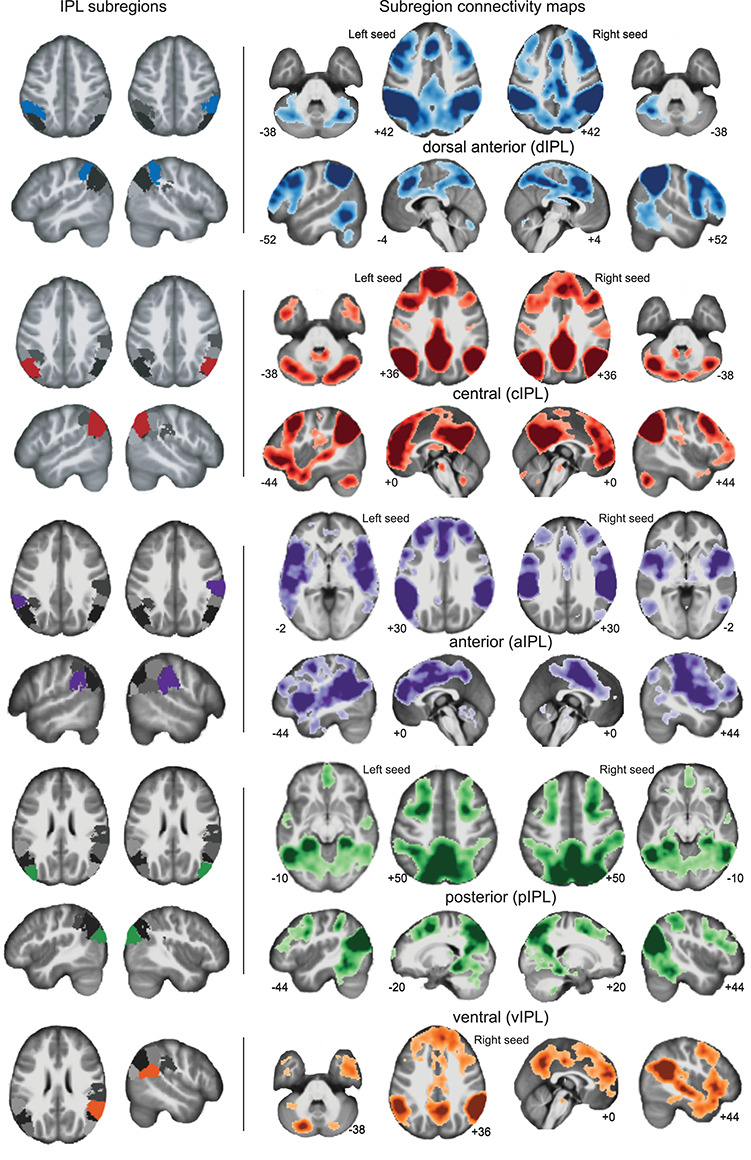
Figure 3.

Subregions of the IPL and corresponding whole-brain networks observed in the TD and ASD dataset (n = 128). The position of the subregion is shown on the far left of the image, with images of the corresponding whole-brain connectivity shown on the center and rightmost panels. Darker shades reflect voxels of higher connectivity strength with the corresponding subregion (P < 0.05, FWE voxelwise correction).
