Figure 2.

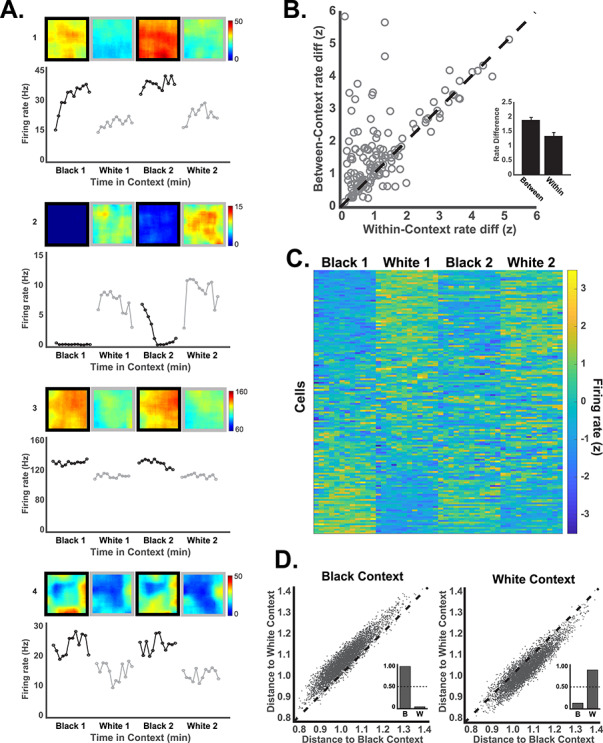
RSC neurons exhibit a rate code for the context. (A) Example neurons illustrating rate coding of the context. For each neuron, the spatial firing rate map is shown above and the average firing rate for the 12 consecutive minutes of each trial is shown in the line plots below. Many rate coding neurons (e.g., 1–3) exhibited little spatial selectivity within the environment, but some neurons exhibited spatial firing with different overall rates in the 2 contexts (e.g., neuron 4 which fired near the walls). (B) Firing rate differences for visits to the black and white contexts (between-context rate differences) are plotted against firing rate differences for visits to the same context (within-context rate differences) for each neuron (circles). Greater differentiation of the 2 contexts, as compared to within-context baseline variability, is indicated by circles above the unity line. Average within- and between-context firing rate differences are shown in the inset. (C) Firing rates across the 4 trials are shown for all neurons in 1 min time windows sorted by firing rate in the first black context trial. The influence of noncontextual variables (e.g., running speed) was statistically removed for illustration (see L–N model methods and Fig. 4). (D) Population firing patterns (250 msec vectors) are plotted in terms of their distance from the mean representation of the black and white contexts. Individual population vectors from the black context (left) were nearly always closer to the average black context representation (dots above the unity line). The inset shows the proportion of population vectors accurately classified as having come from the black context (B) and erroneous classifications to the white context (W). The reverse is seen for population vectors taken from the white context (right).
