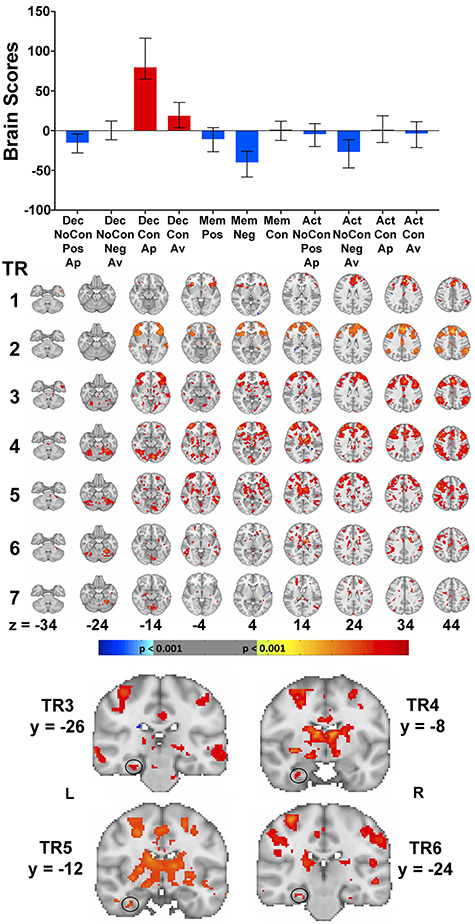
Figure 5.

LV1 reflecting an effect of AA conflict resolution, in particular when an approach response is made. The brain scores (error bars depict 95% CIs) and associated spatiotemporal pattern of activity are shown in the top and middle panels, respectively. Warm colors indicate patterns of increased activity during task conditions with positive brain scores and decreased activity during task conditions with negative brain scores. Cool colors reflect the opposing pattern. Each row reflects each TR during the 14-s time window from the start of stimulus presentation. Increased PRC activity during Decision Conflict Approach and Avoid trials was observed at TRs 3–6 (bottom panel). For the activity maps, activation is thresholded at a bootstrap ratio of 3.28 (P = 0.001) and rendered on the MNI-152 standard template. Significant regions of activity beyond the MTL are listed in Supplementary Table S1. Key: Dec, Decision; Mem, Memory; Act, Action; NoCon, No Conflict; Con, Conflict; Ap, Approach; Av, Avoid; Pos, Positive; Neg, Negative; L, Left; R, Right.
