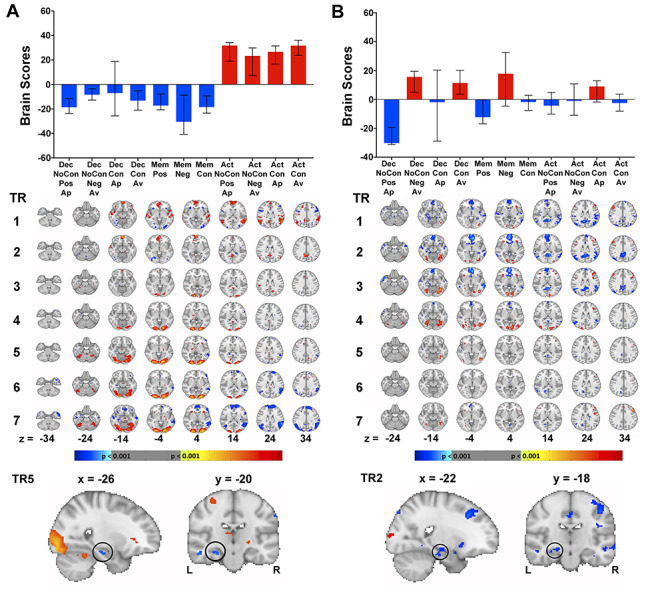
Figure 6.

(A) LV2 reflecting an effect of cognitive and perceptual demands. (B) LV3 possibly reflecting potential point loss versus point gain. For both LVs, the brain scores (error bars depict 95% CIs) and associated spatiotemporal patterns of activity are shown in the top and middle panels, respectively. Warm colors indicate patterns of increased activity during task conditions with positive brain scores and decreased activity during task conditions with negative brain scores. Cool colors reflect the opposing pattern. Each row reflects each TR during the 14-s time window from the start of stimulus presentation. Significant HPC activity is highlighted for LV2 at TR5 and for LV3 at TR2 on sagittal and coronal slices (bottom panel). For all activity maps, activation is thresholded at a bootstrap ratio of 3.28 (P = 0.001) and rendered on the MNI-152 standard template. Significant regions of activity beyond the MTL are listed in Supplementary Tables S2 and S3. Key: Dec, Decision; Mem, Memory; Act, Action; NoCon, No Conflict; Con, Conflict; Ap, Approach; Av, Avoid; Pos, Positive; Neg, Negative; L, Left; R, Right.
