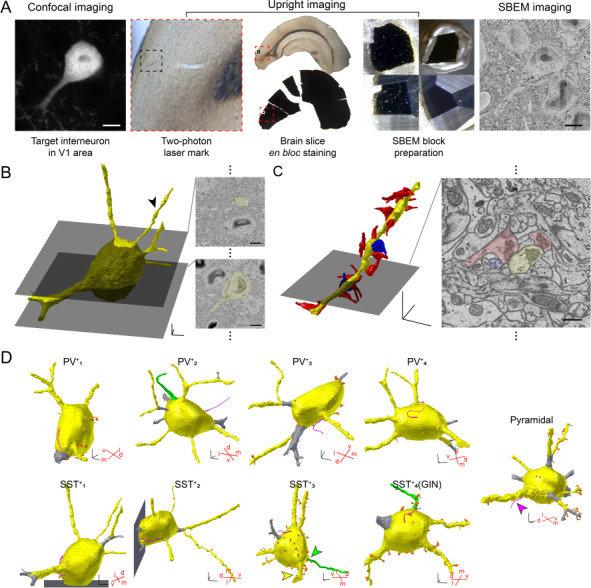
Figure 1.

3D reconstruction of a targeted neuron in the V1. (A) SBEM procedure to image a targeted neuron in the V1: A brain slice containing V1 was obtained from an SST::tdTomato mouse and imaged with a confocal microscope to locate a red fluorescent SST+ neuron. Laser marks were made using a two-photon microscope. The slice was processed for electron microscopy and then trimmed on the pin stub for SBEM imaging. Scale bars, 5 μm; red squares, V1 in the slice; black squares, the local area in the V1 where the target neuron was located. (B) Reconstructed tdTomato+ neuron in (A) (left, yellow) and representative SBEM images of the neurons (right). 3D-scale bar, 3 μm; scale bars, 5 μm. (C) An example dendrite of the neuron in (B, arrowhead). Left, reconstructed excitatory (red) and inhibitory (blue) pre-synaptic inputs; right, a representative image from SBEM. 3D-scale bar, 3 μm; scale bar, 500 nm. (D) 3D reconstruction of the initial processes from the soma (yellow): dendrites (yellow), axons (green), cilia (magenta), and spines (orange). Dendritic segments that were shorter than 5 μm were excluded from the quantitative analysis (gray). Red crosses, ventrodorsal and mediolateral angles of the neuron in the 3D space of the brain samples. 3D-scale bars, 3 μm. Note that all identified axons (1 in PV+ and 2 in SST+) project in the dorsal direction.
