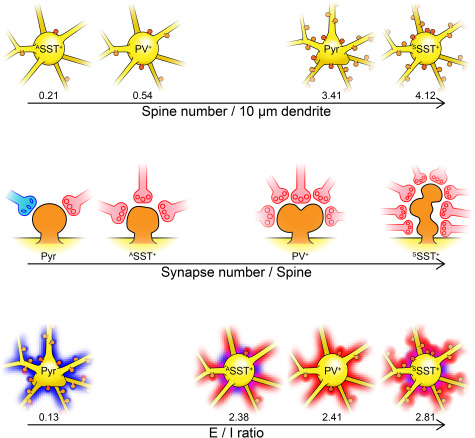
Figure 7.

Organization of synaptic inputs for various cell types in layer 2/3 mouse V1. In this study, we found that the synapse organization in the proximal parts of PV+ and SST+ GABAergic interneurons and the pyramidal neuron were distinguished by their spine density (top), synapse number per spine (middle), and the ratio of excitatory and inhibitory synapses (bottom). Yellow, soma and dendrites; orange, spines; red shade, excitatory inputs; blue shade, inhibitory inputs.
