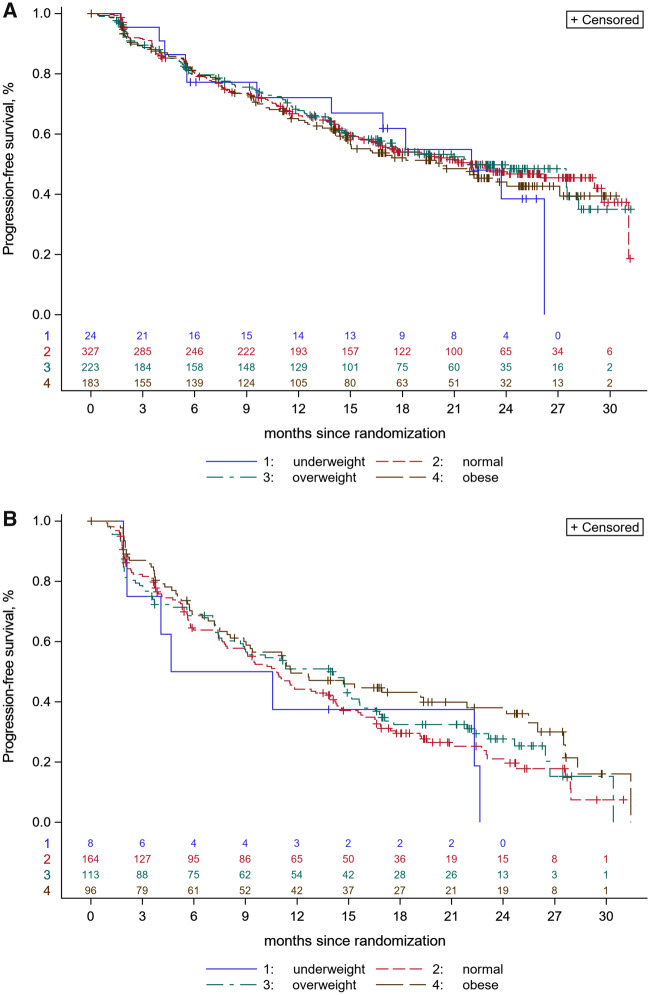
Figure 2.
Kaplan-Meier curves for progression-free survival (PFS) according to body mass index (BMI) categories (underweight, normal weight, overweight, and obese). A) PFS according to the 4 BMI categories in patients receiving abemaciclib + endocrine therapy (ET) (P = .91; 2-sided log-rank test). B) PFS according to the 4 BMI categories in patients receiving placebo + ET (P = .19; 2-sided log-rank test).

