Figure 1.

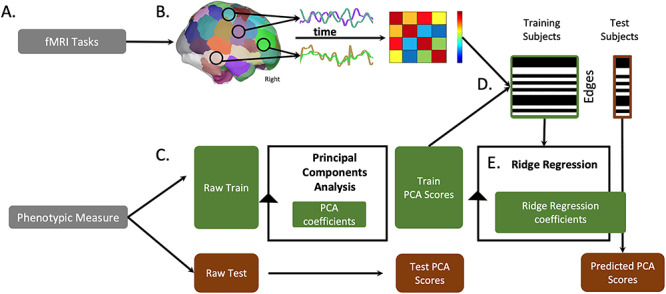
Overview of processing pipeline. (A) We use six fMRI tasks and five categories of phenotypic measures from the Neuropsychiatric Phenomics Consortium dataset (see Methods and Supplementary Materials). (B) We preprocess and divide fMRI volumes using the Shen 268 node atlas. We then create a cross-correlation matrix of internode connectivity, hereafter described as edges. (C) We separate behavior and (D) fMRI data into train and test groups. We perform a principal component analysis to summarize one behavioral construct score per subject; we use the training data’s PCA coefficients to transform the behavioral test data into component space. (D) Across training subjects, we correlate each edge to the phenotypic scores and restrict subsequent analyses to edges with a correlation strength above P < 0.01 (see Supplementary Materials for different statistical thresholds). (E) We use a ridge regression algorithm to train a predictive model wherein edges from all 6 fMRI tasks predict a phenotypic score. We apply this model to the selected edges to predict phenotypic scores for each individual in the test group. Model performance measures are described in Methods.
