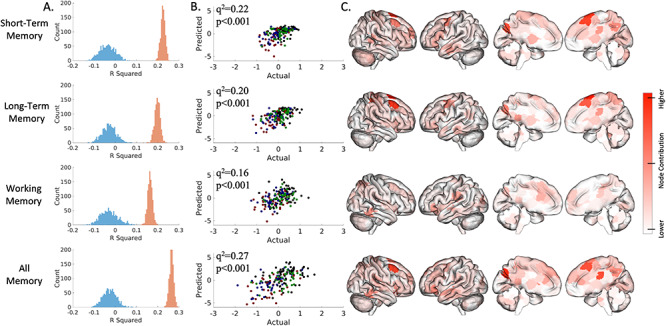
Figure 2.

Connectome-based predictive model performance for transdiagnostic 10-fold cross-validation. The left column (A) shows a histogram of the model performance across 1000 iterations of the actual (red) and randomly permuted (blue) data. The middle column (B) shows how actual and predicted values compare for the median-performing model (green, SCZ; blue, BPAD; red, ADHD). The right columns (C) show surface plots of each node’s degree, which is defined as the number of edges per node that were weighted in 95% of iterations (the short-term memory model includes 289 consistently weighted edges; long-term, 276 edges; working, 174; all, 362). Leave-one-group-out analyses are presented in the Supplementary Materials.
