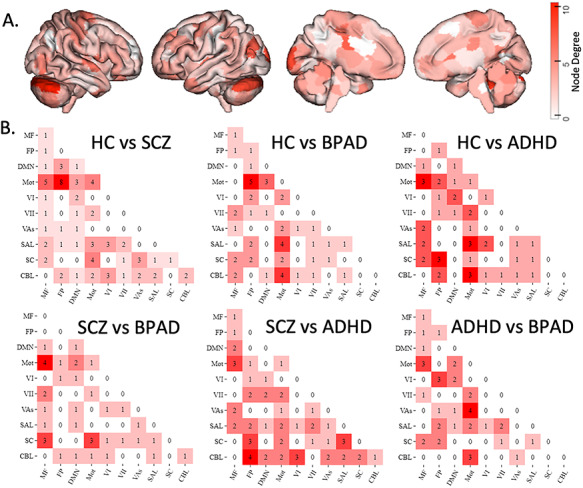
Figure 3.

Mass multivariate analysis of disease group differences in brain network structure across all tasks. (A) Surface illustration of nodes where edges (network connections) significantly differ across all clinical groups, as measured with Hotelling’s T2. (B) illustrates significant network-to-network edges. (Circle plots showing nonsummarized edges can be referenced in the Supplementary Materials; Network Labels: MF, medial frontal; FP, frontoparietal; DMN, default mode; Mot, motor cortex; VI, visual A; VII, visual B; VAs, visual association; SAL, salience; SC, subcortical; CBL, cerebellum).
