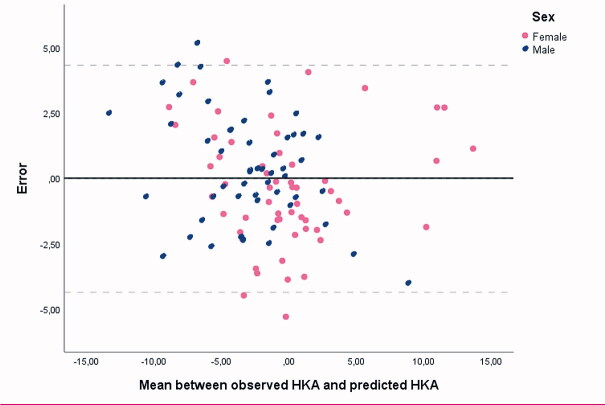
Figure 3.
Bland–Altman plot depicting the error between the observed HKAA (gold standard) and the predicted HKAA in the cross-validation setting. Negative numbers represent the degree of varus alignment and positive numbers represent the degree of valgus alignment. The solid line depicts the mean error and the dotted lines the 95% confidence interval.

