
Figure 4.
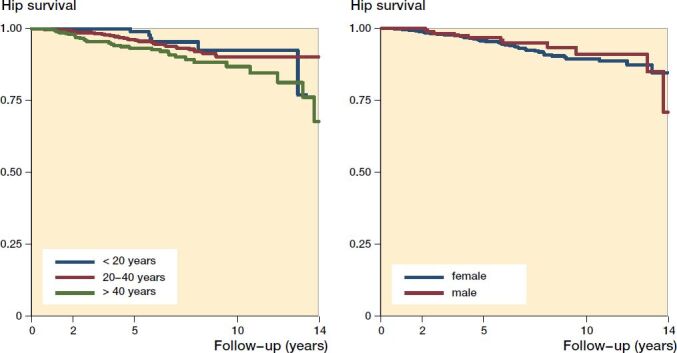
Kaplan–Meier survivorship curve, with conversion to total hip arthroplasty as endpoint for 1,385 hips after periacetabular osteotomy divided according to the age groups < 20 years, 20–40 years, > 40 years at surgery (left) and for each sex (right). Each decrease corresponds to a conversion to total hip arthroplasty. Log-rank test between age groups showed a p-value of 0.03 indicating a significant difference in survival and between the 2 sexes a p-value of 0.6 indicating no significant difference.