
Figure 5.
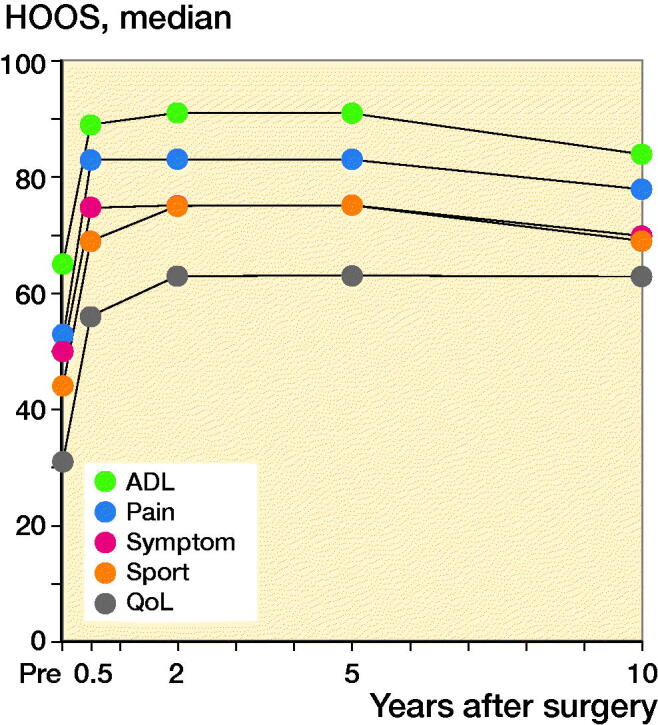
Graph showing the median scores preoperatively and at follow-up times for each Hip disability and Osteoarthritis Outcome Score subscale. Each Hip disability and Osteoarthritis Outcome Score showed a significant development over time for all subscales from preoperatively to 5 years with a p-value < 0.001.