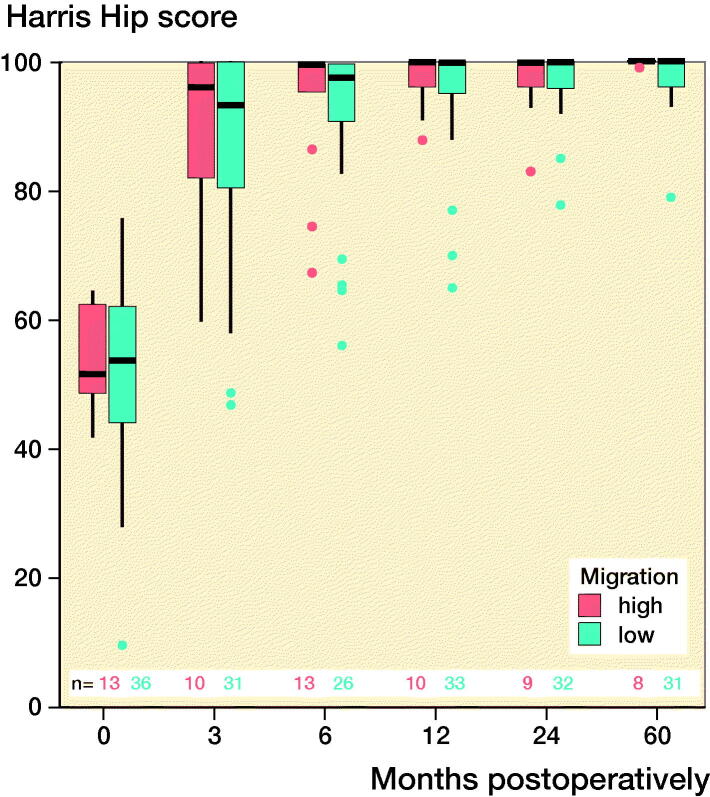
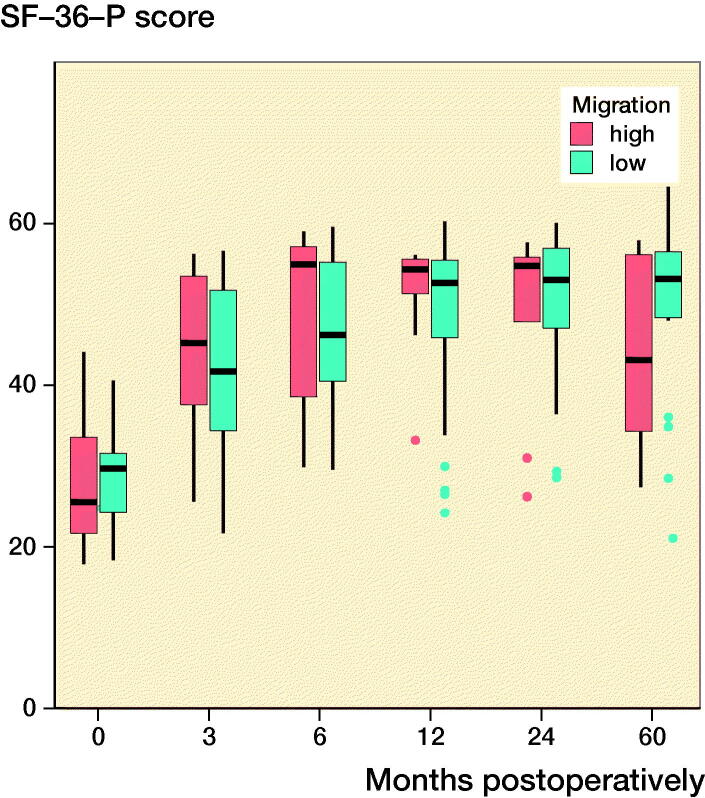
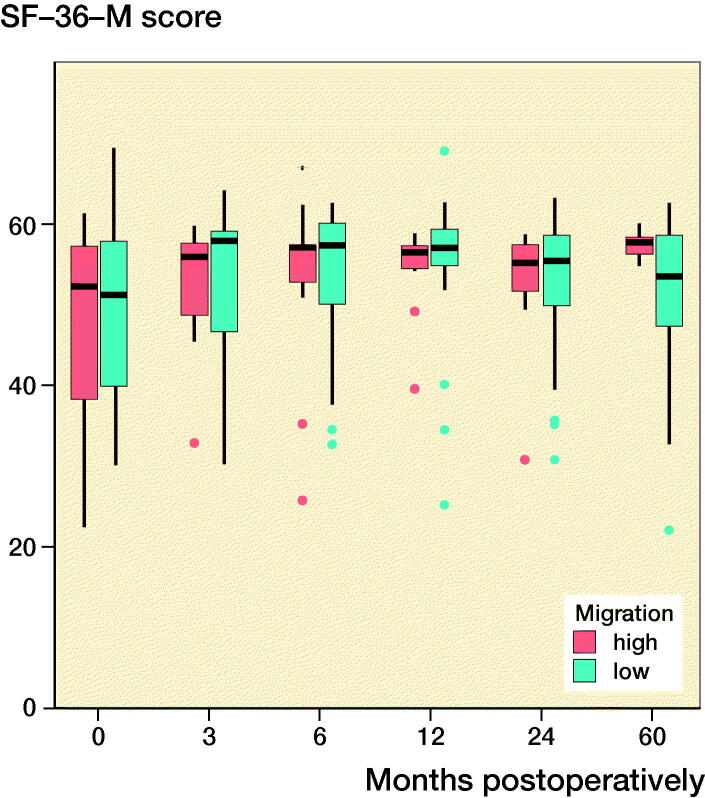
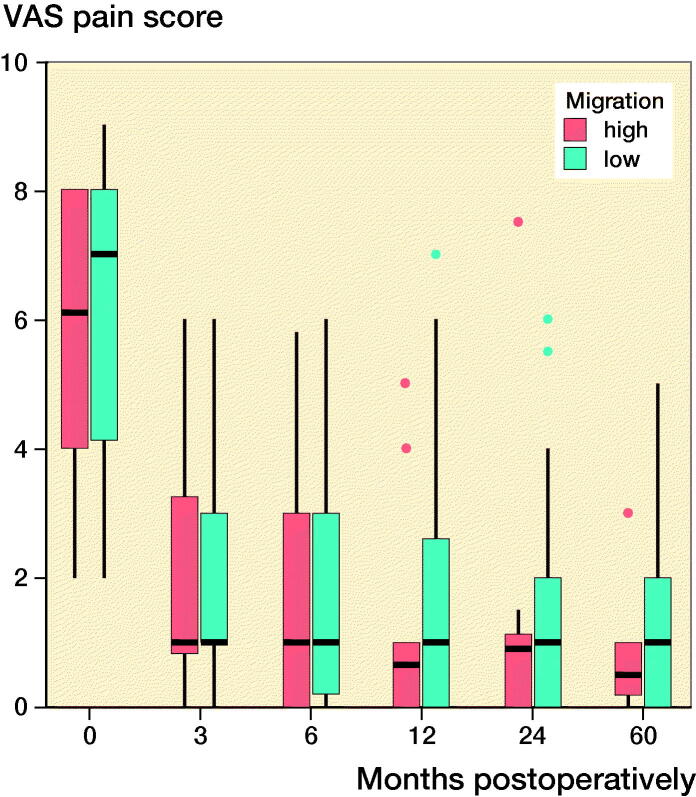
Figure 3.
Clinical scores at each follow-up interval. There were no significant differences between the groups. ν represents the ≥ 75% group and ν represents the < 75% group. (Harris Hip score; SF-36-P: Physical functioning scale of the Short Form-36; SF-36-M: Mental health domain of the Short Form-36; VAS: Visual analog scale pain score).


