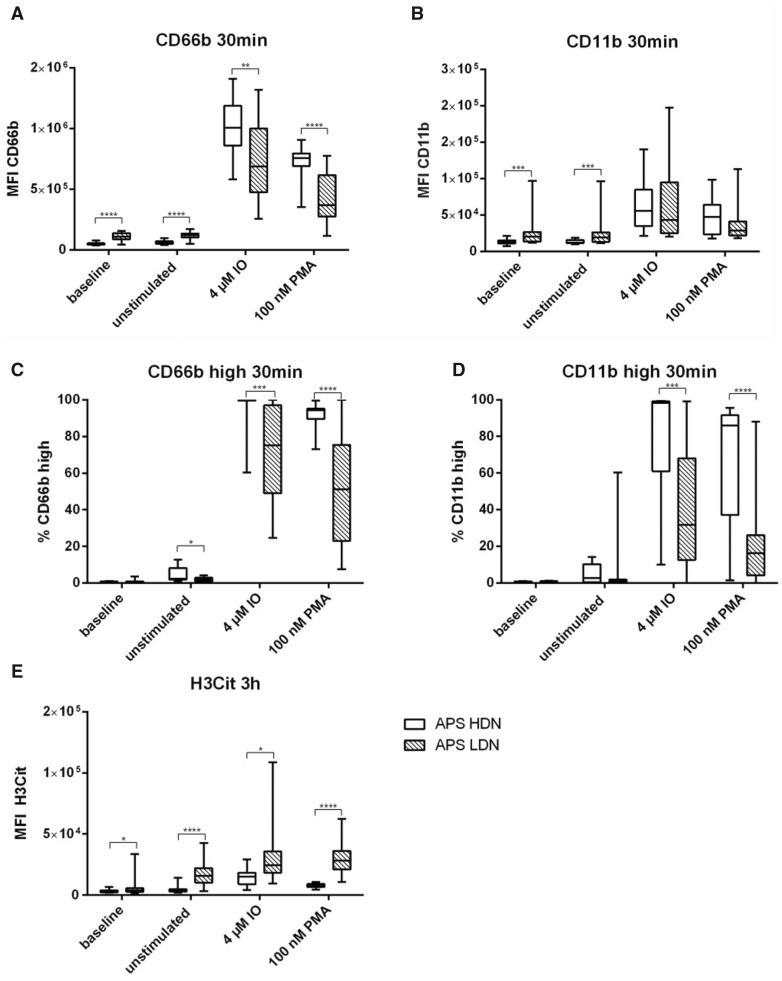
Fig. 2.
Differences between HDNs and LDNs in patients with APS
Neutrophil subpopulations isolated from 20 patients with APS at baseline (immediately fixed after isolation), untreated and after stimulation with IO and PMA. (A) MFI of CD66b and (B) CD11b as well as (C) % of CD66b high and (D) % of CD11b high of HDNs (clear boxes) and LDNs (scattered boxes) after treatment for 30 min at 37°C. (E) MFI of H3Cit after stimulation for 3 h at 37°C. Statistical analysis was performed using Mann–Whitney U test. H3Cit: citrullinated histone H3; IO: ionomycin; LDN: low density neutrophil; MFI: mean fluorescent intensity; PMA: phorbol 12-myristate 13-acetate. *P ≤0.05; **P ≤0.01; ***P ≤0.001; ****P ≤0.0001.

