. 2021 Mar 31;10:e65012. doi: 10.7554/eLife.65012

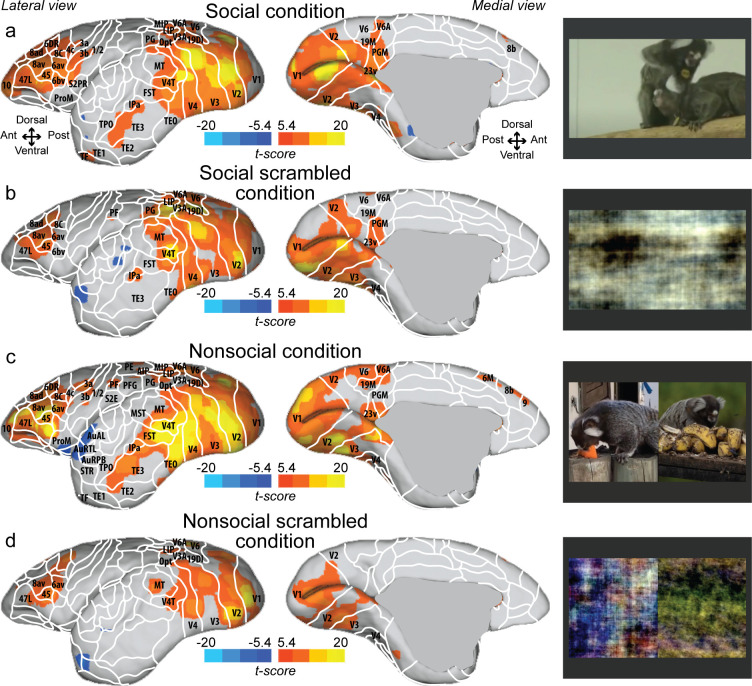
Figure 1. Group functional topology maps for social (a), social scrambled (b), nonsocial (c), and nonsocial scrambled conditions (d).

Maps are displayed on the right fiducial brain surface (lateral and medial views). The white line delineates the regions based on the atlas from Paxinos et al., 2011. The regions associated with yellow/orange scale correspond to t-scores ≥ 5.4 (p<0.001, AFNI’s 3dttest++, cluster-size correction from Monte Carlo simulation, α = 0.05). The regions associated with blue scale correspond to t-scores ≤ –5.4 (p<0.001, AFNI’s 3dttest++, cluster-size correction from Monte Carlo simulation, α = 0.05). Group maps for the left hemisphere and individual maps for both hemispheres are shown in Figure 1—figure supplement 1 and Figure 1—figure supplement 2, respectively.

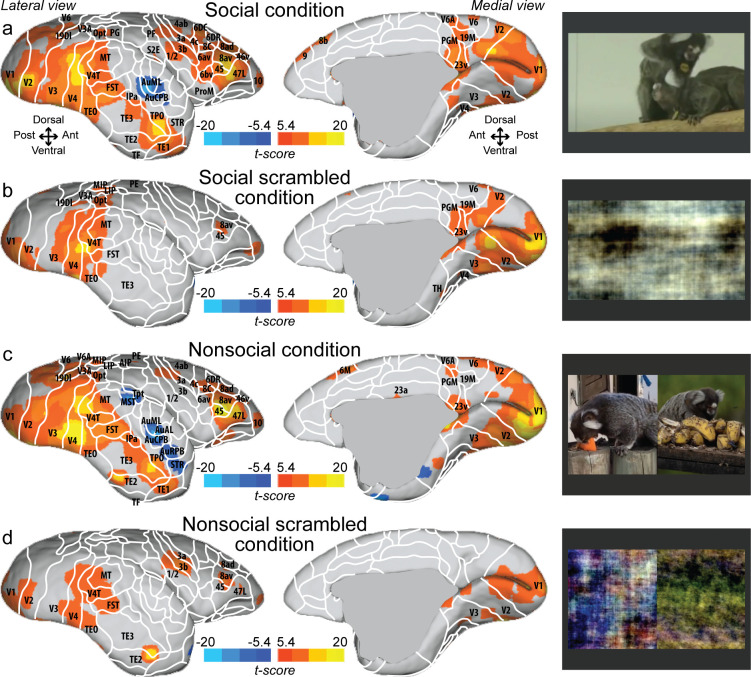
Figure 1.

Figure 1—figure supplement 1. Group functional topology maps for social (a), social scrambled (b), nonsocial (c), and nonsocial scrambled conditions (d).

Figure 1—figure supplement 1.

Maps are displayed on the left fiducial brain surface (lateral and medial views). The white line delineates the regions based on the atlas from Paxinos et al., 2011. The regions associated with yellow/orange scale correspond to t-scores ≥ 5.4 (p<0.001, AFNI’s 3dttest++, cluster-size correction from Monte Carlo simulation, α = 0.05). The regions associated with blue scale correspond to t-scores ≤ –5.4 (p<0.001, AFNI’s 3dttest++, cluster-size correction from Monte Carlo simulation, α = 0.05).

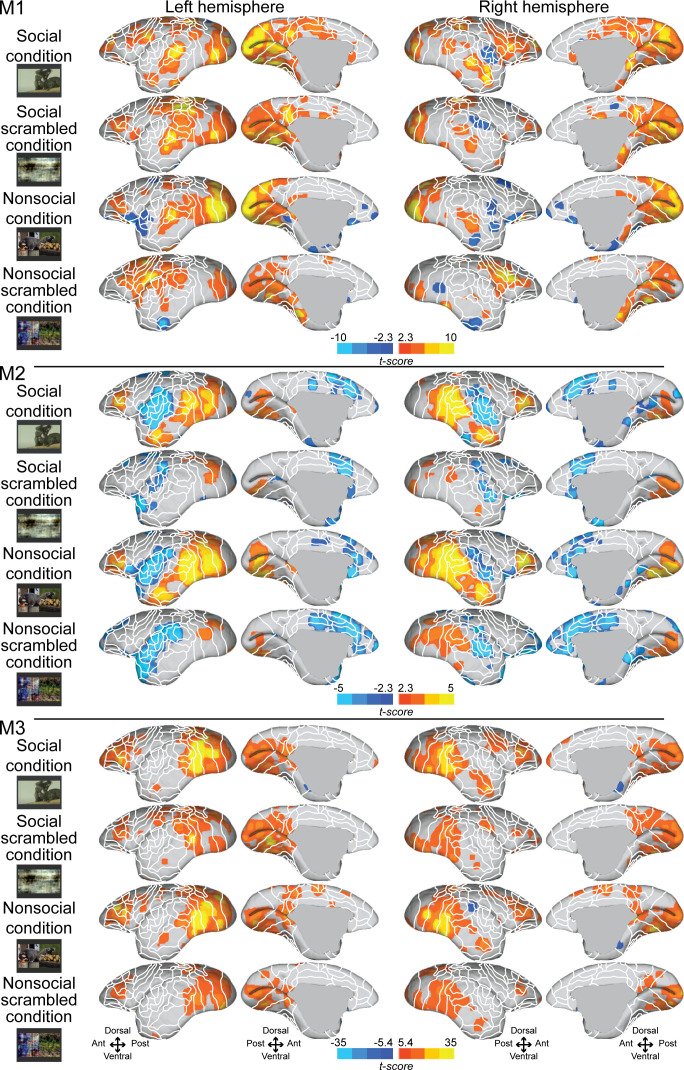
Figure 1—figure supplement 2. Individual functional topology maps for social (a), social scrambled (b), nonsocial (c), and nonsocial scrambled conditions (d) in monkeys 1–3.

Figure 1—figure supplement 2.

Maps are displayed on both fiducial brain surface (lateral and medial views). The white line delineates the regions based on the atlas from Paxinos et al., 2011. The regions associated with yellow/orange scale correspond to t-scores ≥ 2.3 (p<0.05, AFNI’s 3dttest++, cluster-size correction from Monte Carlo simulation, α = 0.05) for monkeys 1 and 2; and t-scores ≥ 5.4 (p<0.001, AFNI’s 3dttest++, cluster-size correction from Monte Carlo simulation, α = 0.05) for monkey 3. The regions associated with blue scale correspond to t-scores ≤ –2.3 (p<0.05, AFNI’s 3dttest++, cluster-size correction from Monte Carlo simulation, α = 0.05) for monkeys 1 and 2; and t-scores ≥ −5.4 (p<0.001, AFNI’s 3dttest++, cluster-size correction from Monte Carlo simulation, α = 0.05) for monkey 3.