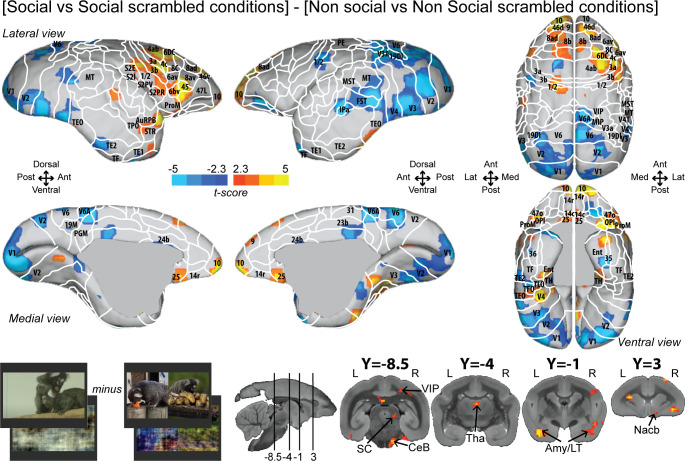
Figure 3. Group functional topology of the interaction effect [social vs. social scrambled] minus [nonsocial vs. nonsocial scrambled].
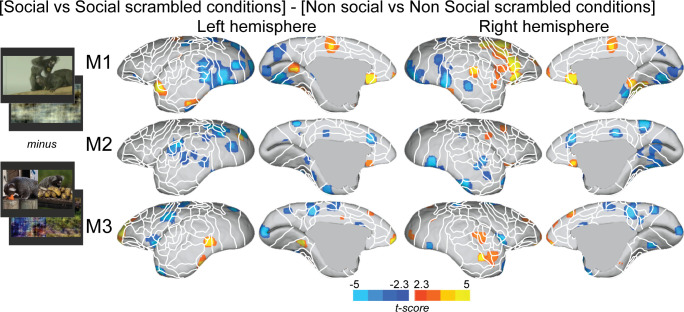
Groups maps are displayed on the right and left fiducial marmoset brain surface (lateral, medial, ventral, and dorsal views) and coronal slices. The white line delineates the regions based on the atlas from Paxinos et al., 2011. Y-coordinates are calculated with respect to the anterior commissure (in millimeters). The regions associated with yellow/orange scale correspond to t-scores ≥ 2.3 (p<0.05, AFNI’s 3dttest++, cluster-size correction from Monte Carlo simulation, α = 0.05). The regions associated with blue scale correspond to t-scores ≤ –2.3 (p<0.05, AFNI’s 3dttest++, cluster-size correction from Monte Carlo simulation, α = 0.05). Nomenclature for coronal slices is as follows: Amy/LT: amygdala/lateral temporal; CeB: cerebellum; Nacb: nucleus accumbens; SC: superior colliculus; Tha: thalamus; VIP: ventral intraparietal area. Individual maps for both hemispheres are shown in Figure 3—figure supplement 1.


