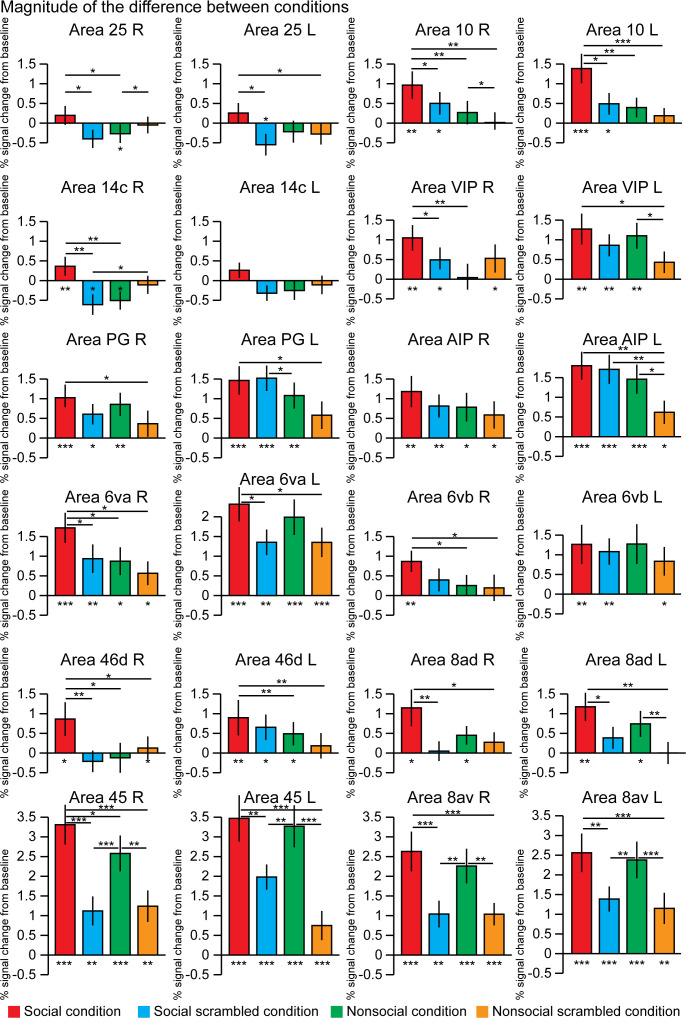
Figure 4. The magnitude of the difference between conditions within 12 regions of interests.
These differences were calculated after extraction of the time series from these regions defined in the left and right hemisphere using the Paxinos et al., 2011 atlas and based on the group activation maps. The differences from the baseline (below each bar graph) and conditions (horizontal bars) were assessed using paired t-test, *p<0.05, **p<0.01, ***p<0.001. The error bars correspond to the standard error.

