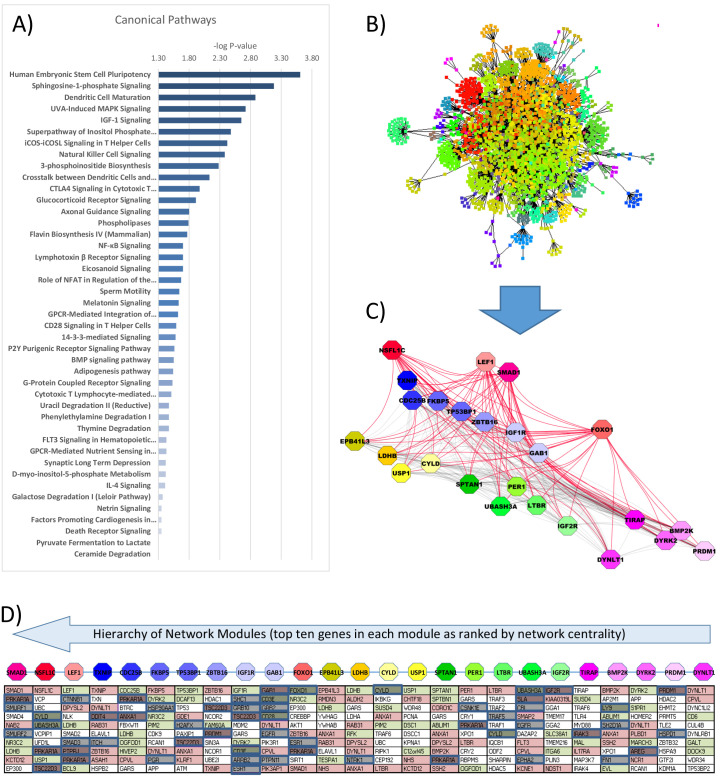
Appendix 2—figure 1. Gene ontology and interactome network model of differential gene expression in peripheral blood mononuclear cells (PBMCs) between glucocorticoid (GC) exposure and GC withdrawal.
Differentially expressed transcriptomic data in PBMCs was used to determine (A) the canonical pathways involved and (B) infer an interactome network model using BioGRID database, consisting of 2467 nodes and 64 modules. (C) Modules of genes (octagons) within the interactome network model were determined using the Moduland algorithm and ranked by a hierarchy based on network centrality; central modules are functionally relevant as they can influence the activity of a wider proportion of the network. The modules are arranged (left to right) in columns of the top 10 genes in each ranked by network centrality (top to bottom). (D) Gene expression marked within the network model (red: up; green: down in hydrocortisone treatment). Causal elements (known literature associations implying regulatory function) are marked in blue.

