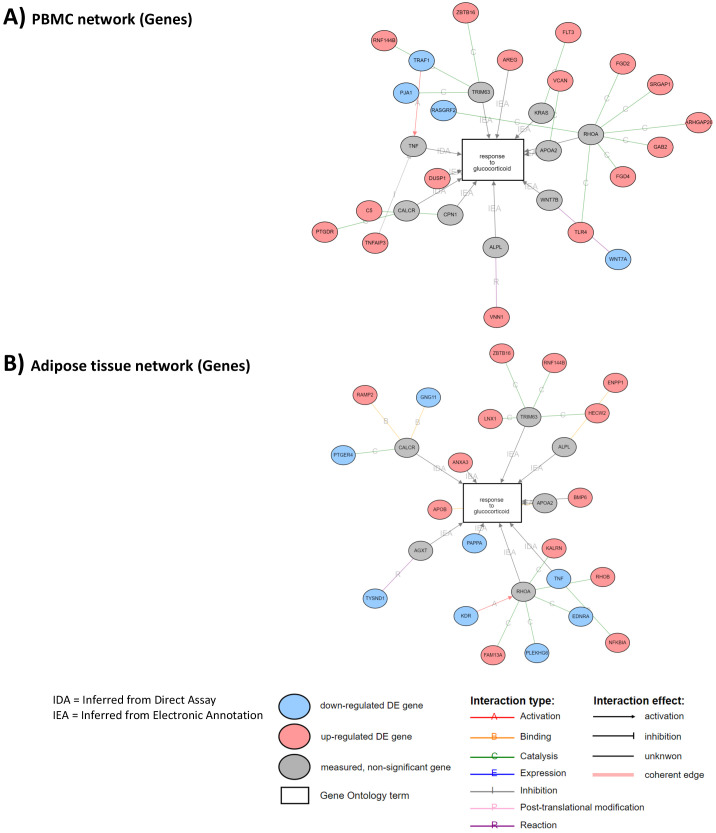
Appendix 2—figure 2. Correlated networks related to glucocorticoid (GC) action in the peripheral blood mononuclear cell (PBMC) and adipose tissue transcriptome.
The analyses were performed to identify similarities and differences in transcriptome (gene expression) associated to GC exposure in two different tissues. Network associations of GC response to genes with differential expression between GC exposure and GC withdrawal in (A) PBMC transcriptome and (B) adipose tissue transcriptome. Gray circles represent genes involved in response to GCs that are not differentially expressed. Sixteen genes up-regulated and four down-regulated in PBMCs. Thirteen genes up-regulated and eight down-regulated in adipose tissue.

