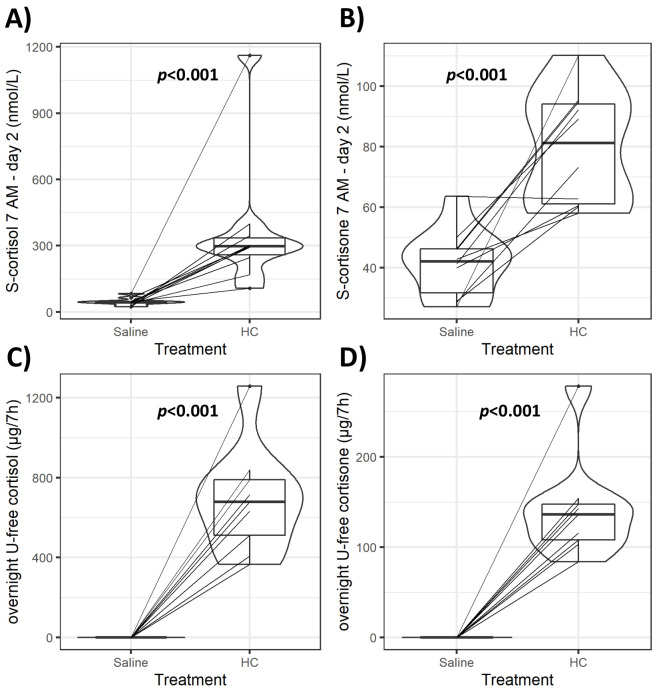
Figure 2. Violin plots of serum and urinary glucocorticoids (GCs) during GC exposure and withdrawal.
Individual data and changes for morning (7 AM) serum cortisol and cortisone (A, B), and overnight (12 AM to 7 AM) urinary-free (U-free) cortisol and cortisone (C, D) from both interventions. Boxes represent interquartile range (IQR); whiskers mark spread of points within 1.5 times IQR; violins demonstrate distribution of results with the maximum width representing the highest density within each violin. Difference of median values between interventions is presented with p-values. HC: hydrocortisone.

