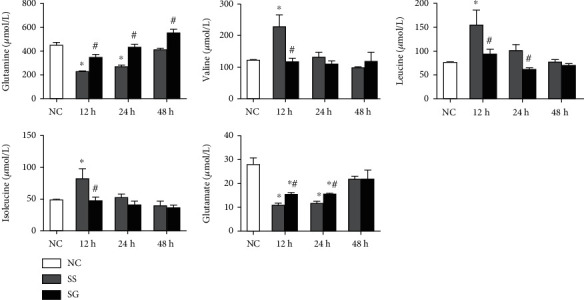
Figure 1.

Plasma amino acid concentrations in the normal control (NC) and the sepsis groups at different time points. SS: sepsis group with saline; SG: sepsis group with glutamine. Values are expressed as the mean ± SEM. All data are representative of duplicate measurements at 12, 24, and 48 h after cecal ligation and puncture (CLP) (n = 8 for each respective group). Differences between 2 sepsis groups at the same time point were analyzed by t-test. The comparison among NC and the sepsis groups at three different time points were analyzed by a one-way analysis of variance (ANOVA) followed by Tukey's post hoc test. ∗Significantly differs from the NC group; #significantly differs from the SS group at the same time point (p < 0.05).
