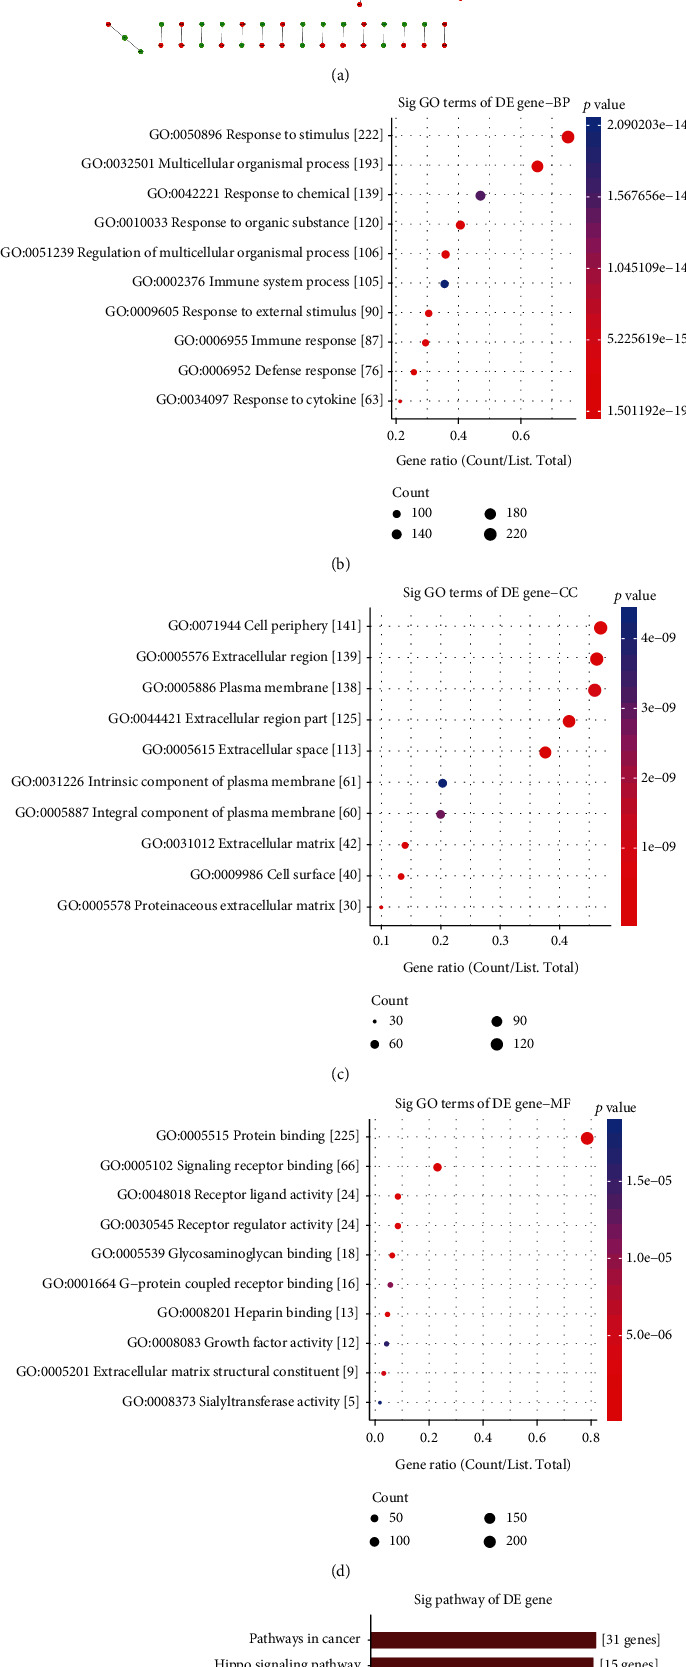
Figure 4.

Construction of a PPI network for common DEGs and function annotation analysis. (a) A PPI network was established based on common DEGs. Red represents upregulation and green represents down-regulation. Nodes are proportional to the size of the circle. The top ten GO enrichment analysis results for genes in the network including biological process (b), cellular component (c), and molecular function (d). (e) The top ten KEGG pathway enrichment analysis results for genes in the network.
